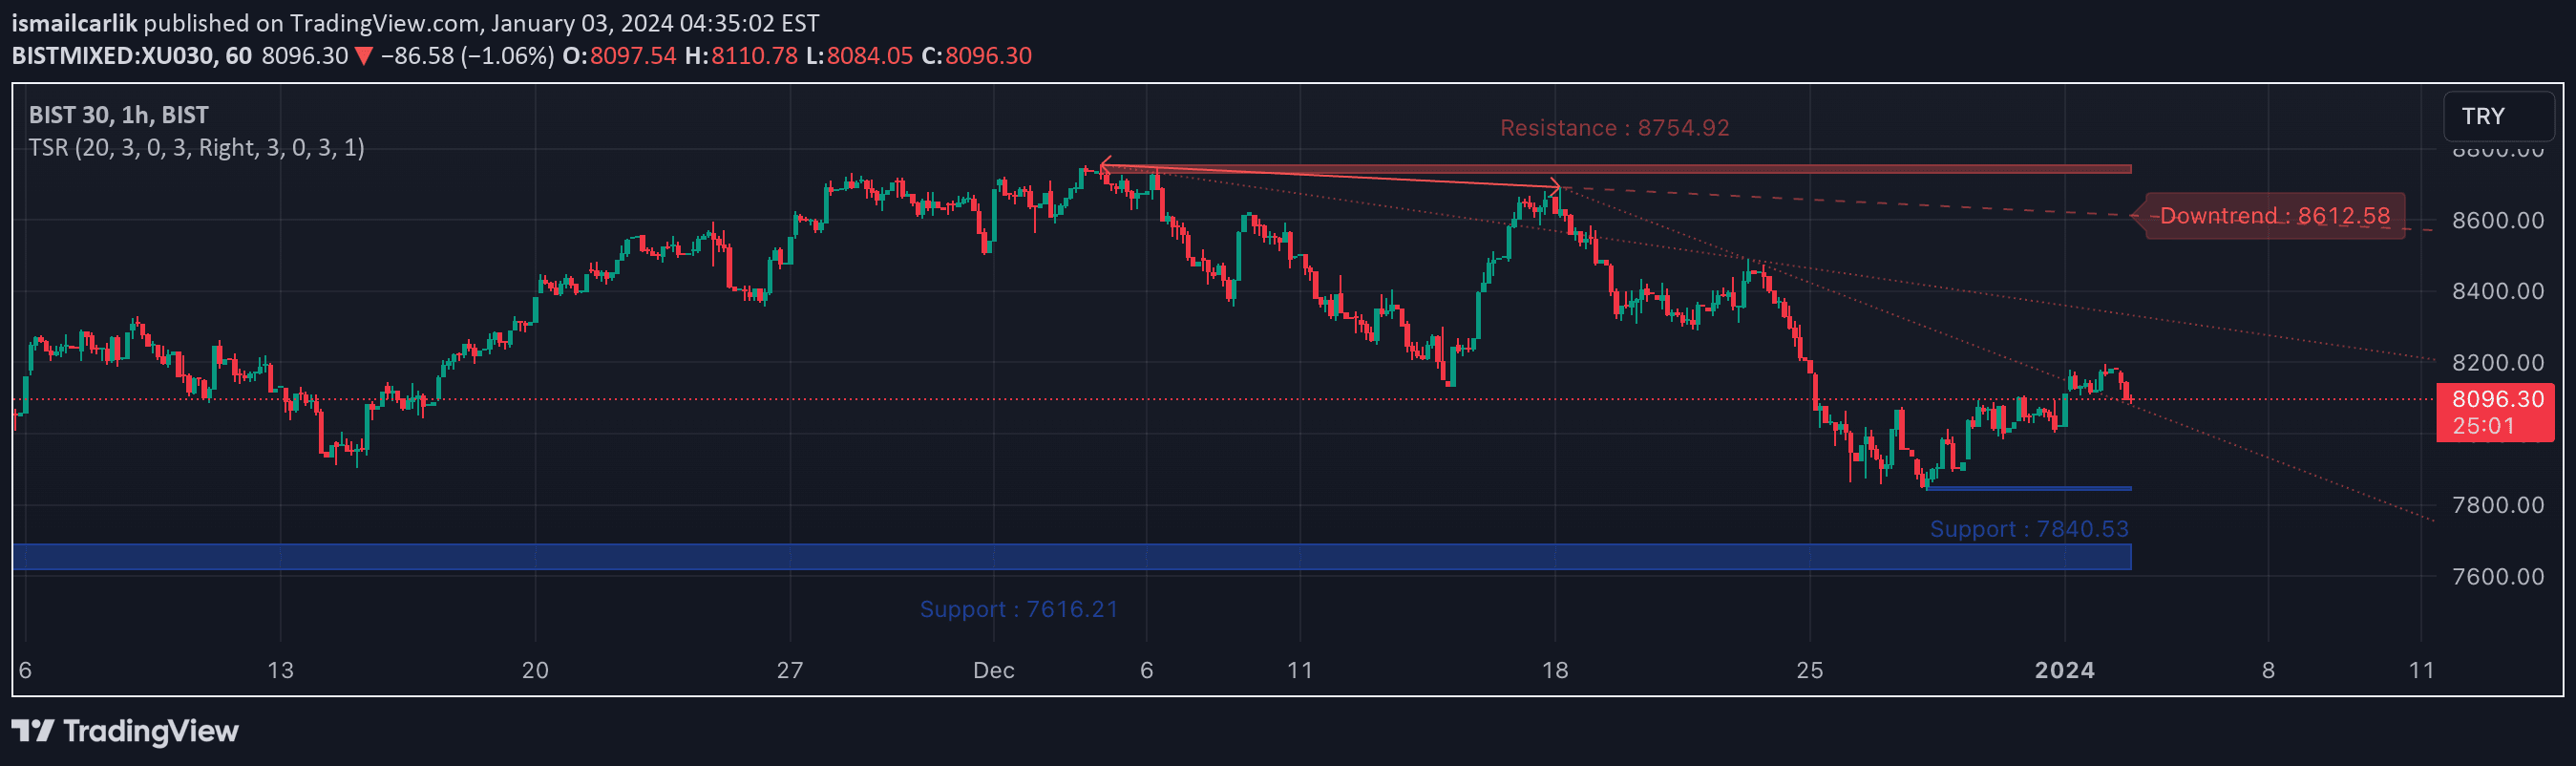
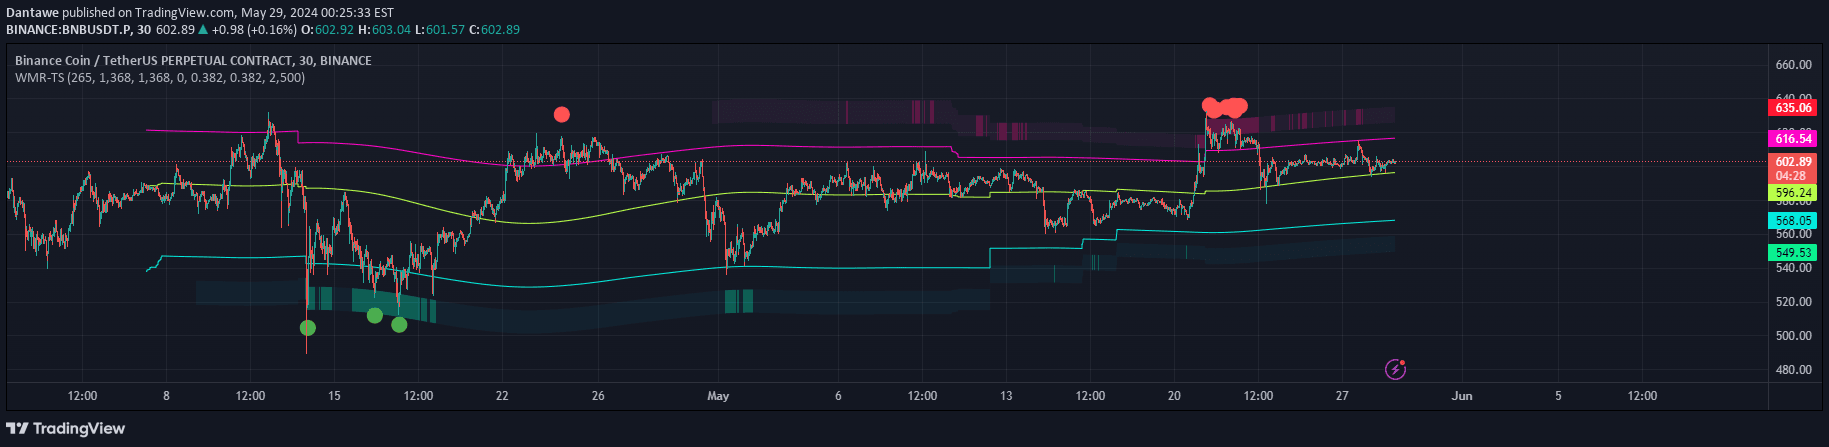
A trading script that identifies market trends using EMA calculations, color-codes candlesticks, and highlights potential liquidity zones through dynamic pivot level tracking.
Explore complementary indicator rolesHow it works
The script first calculates two Exponential Moving Average (EMA) values to detect market trend direction. It computes a standard EMA based on a specified length and creates a correction value representing price movement relative to the EMA. A secondary trend calculation is performed by applying another EMA to the corrected value.
When the trend crosses the initial EMA value, it generates bullish (signalUp) or bearish (signalDn) signals. The script then color-codes candlesticks based on the detected trend: blue for uptrends, pink for downtrends, and no color for neutral trends. Additionally, it identifies pivot highs and lows using a customizable pivot length.
Why it may be useful
This script provides traders with a comprehensive visual tool for understanding market dynamics and potential trading opportunities. By combining trend detection, candlestick coloration, and liquidity zone identification, it offers a multi-dimensional view of price action that can help traders make more informed decisions.
The color-coded candles and extended pivot lines make it easier to spot support and resistance levels, potential breakout points, and trend changes. Traders can quickly assess market sentiment and identify key price levels where significant market movements might occur, enhancing their ability to time entries and exits more effectively.
When to explore it
The script is most effective in markets with clear trending characteristics, where price movements show consistent directional momentum. It works well in timeframes ranging from short-term (minutes) to medium-term (hours), making it particularly useful for scalpers and day traders seeking to capitalize on quick price movements.
Traders should use this script in liquid markets with sufficient trading volume, such as major forex pairs, popular stock indices, and actively traded commodities. It is especially valuable during periods of market volatility when trend identification and liquidity zone recognition can provide critical insights into potential price reversals and continuation patterns.
Keep exploring
What we’ve verified
Access, alerts and repainting behaviour have not been independently verified for this indicator. Check the creator’s current publication and settings.
General descriptions and classifications are recovered research. Verified details above identify the specific checks we have completed. Check the creator’s current publication for later changes.