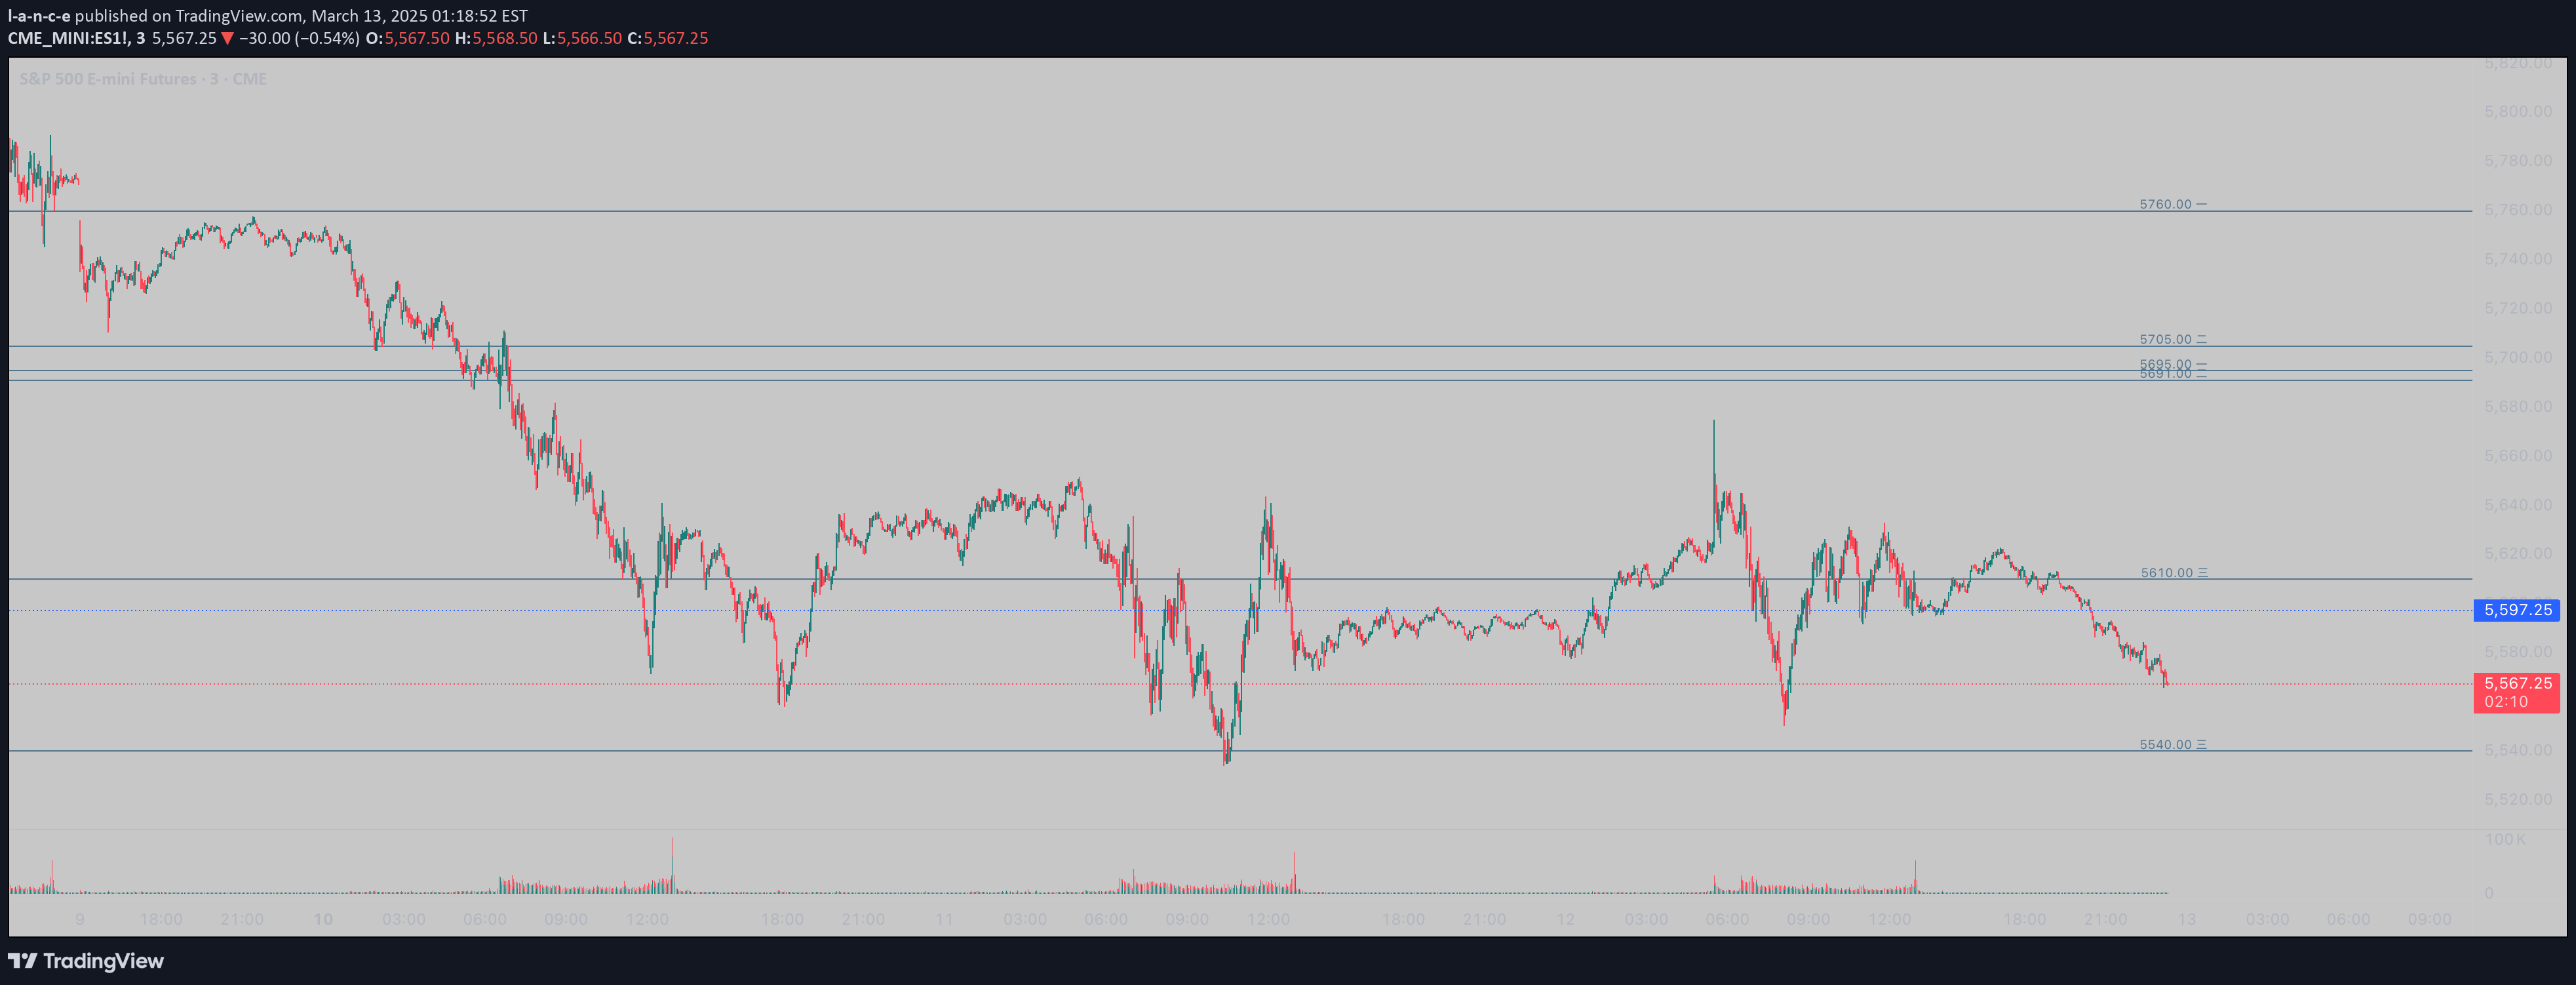
A technical indicator that identifies potential price breakouts and reversals by marking high and low pivots, fair value lines, and tracking market turning points using geometric shapes.
Explore complementary indicator rolesHow it works
The indicator analyzes price movements by establishing high and low pivots within a customizable lookback period. It calculates a fair value line positioned at the midpoint between these pivots, creating a reference point for potential market shifts.
By tracking closing prices relative to these pivot points, the system generates signals for bullish and bearish breakouts. When prices cross above the high pivot or below the low pivot, the indicator identifies potential trading opportunities using geometric shapes like triangles and diamonds to visually represent these key market events.
Why it may be useful
Technical traders rely on this indicator to quickly identify potential trend reversals and breakout opportunities across different market conditions. By providing clear visual markers and objective measurement criteria, the tool helps traders make more informed decisions about market entry and exit points.
The indicator's ability to dynamically track price movements and highlight significant levels enables traders to recognize emerging market trends with greater precision. Its flexible configuration and alert system allow traders to customize their analysis and respond promptly to changing market dynamics.
When to explore it
This indicator is most effective in markets with clear trending behavior and distinct price movements. It performs exceptionally well in volatile markets where rapid price changes and potential reversals are more likely to occur, such as during economic announcements or significant market events.
Traders should consider using this indicator across multiple timeframes, from short-term scalping to longer-term swing trading. Its versatility makes it valuable for analyzing various financial instruments, including stocks, forex, commodities, and cryptocurrencies, where identifying key turning points can provide a strategic advantage.
Keep exploring
What we’ve verified
Access, alerts and repainting behaviour have not been independently verified for this indicator. Check the creator’s current publication and settings.
General descriptions and classifications are recovered research. Verified details above identify the specific checks we have completed. Check the creator’s current publication for later changes.