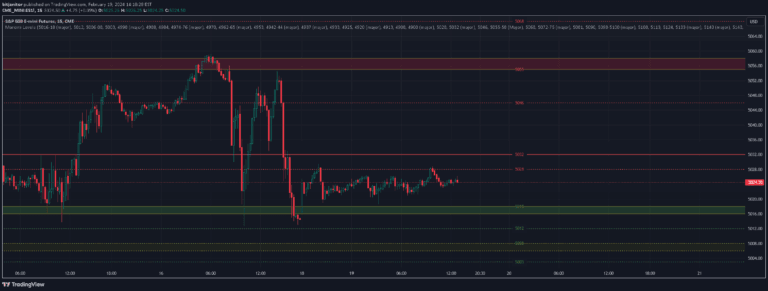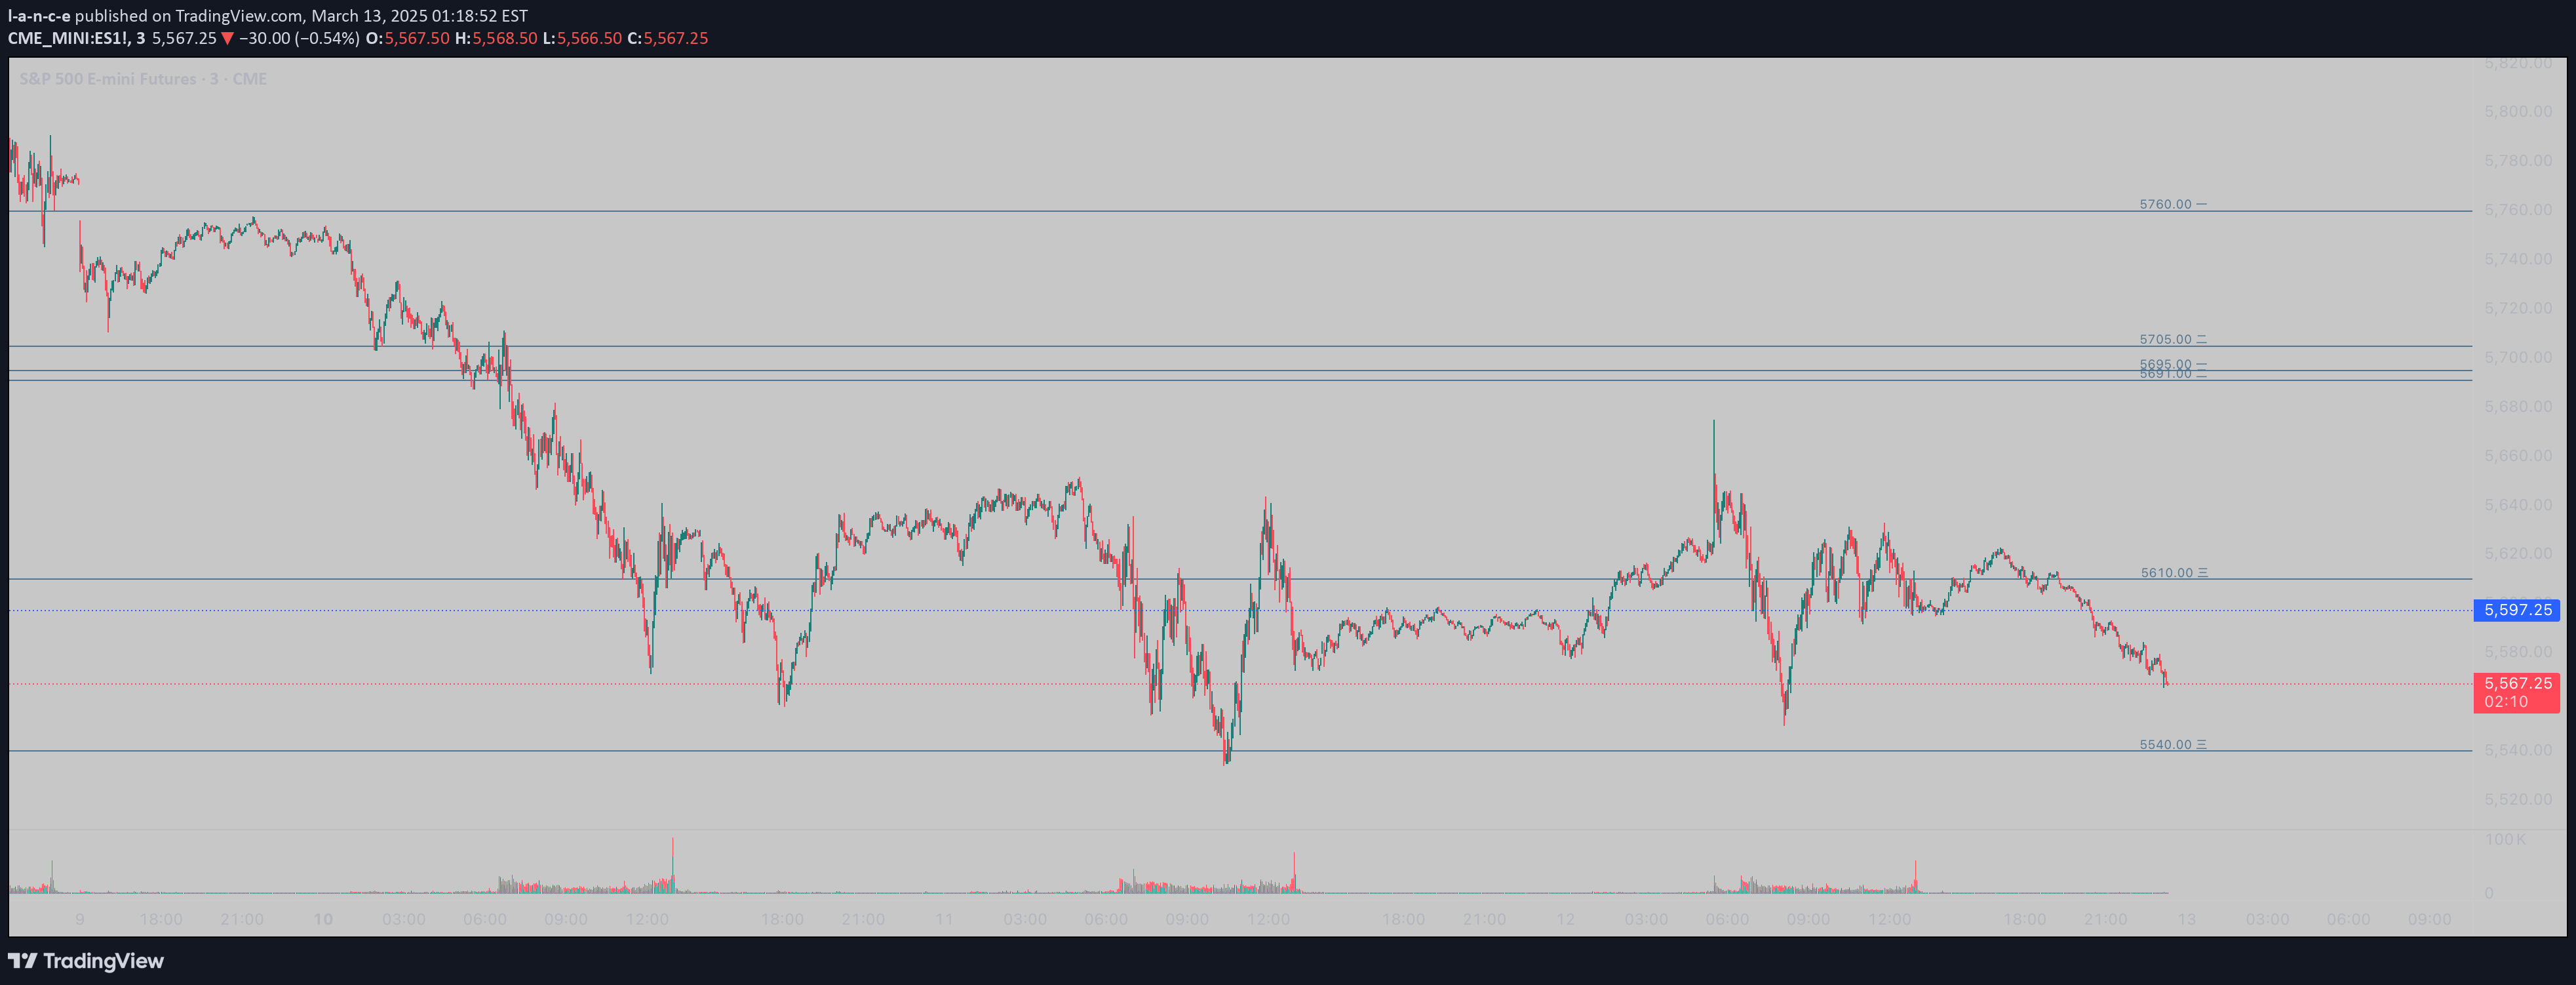
A script that draws horizontal levels at specified price points, allowing traders to quickly mark and visualize key support and resistance levels from Mancini's newsletter.
Explore complementary indicator rolesHow it works
The script enables traders to input specific price levels across three different groups, automatically drawing horizontal lines at those precise points. Each group can contain multiple comma-separated values, which are then plotted directly on the price chart with corresponding labels indicating their group designation.
Users can manually enter levels from Mancini's newsletter, categorizing them into different groups for better organization and visual distinction. The script allows for quick and easy visualization of key support and resistance levels without complex manual drawing or calculations.
Why it may be useful
Identifying and tracking key price levels is crucial for understanding potential market support and resistance zones where price might reverse or consolidate. These levels provide traders with critical insights into potential entry, exit, and stop-loss points, helping to manage risk and make more informed trading decisions.
By systematically organizing levels into different groups, traders can quickly distinguish between regular, major, and crucial levels, enhancing their ability to prioritize and respond to significant price movements more effectively.
When to explore it
This tool is most effective when trading in markets with clear, identifiable support and resistance levels, such as forex, stocks, or futures with well-defined technical characteristics. Traders should focus on using these levels during periods of range-bound or trending markets where key price points play a significant role in price action.
The script is particularly useful for traders following Mancini's newsletter or those who rely on predefined levels for their trading strategy. It provides a quick, visual method of tracking important price zones without manually drawing multiple lines or losing track of critical levels.
Keep exploring
What we’ve verified
Access, alerts and repainting behaviour have not been independently verified for this indicator. Check the creator’s current publication and settings.
General descriptions and classifications are recovered research. Verified details above identify the specific checks we have completed. Check the creator’s current publication for later changes.