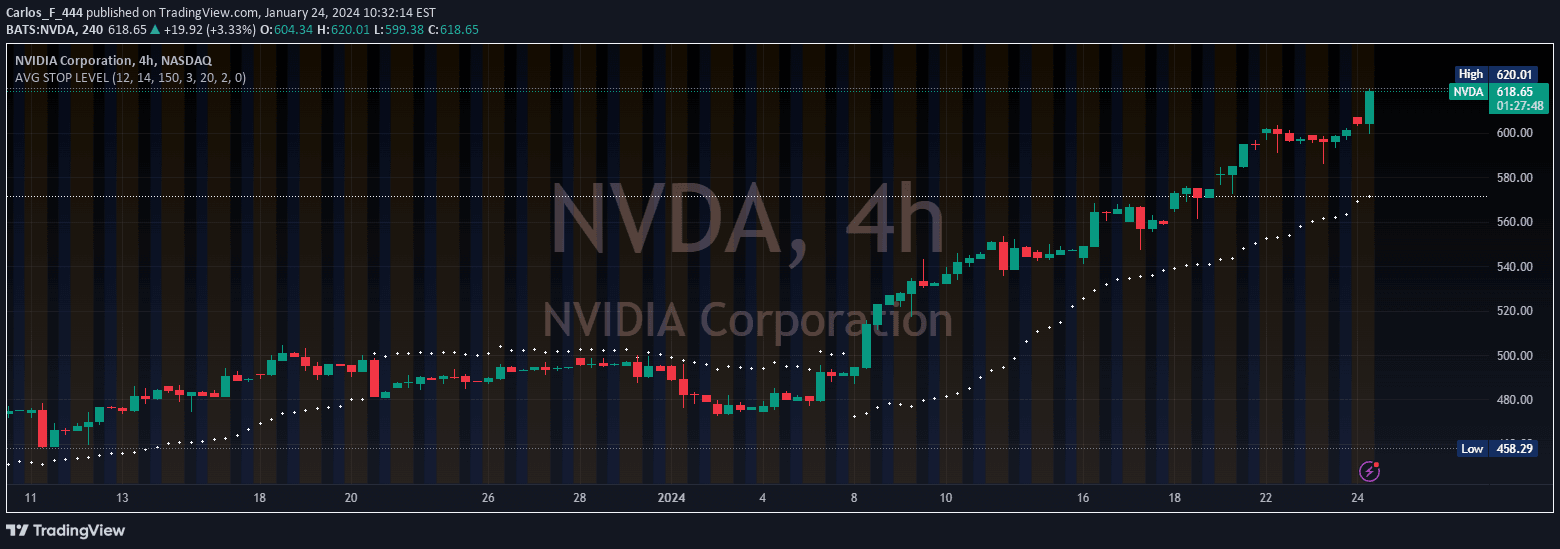
A technical indicator calculating the daily percentage change for American futures, providing insights into market volatility and potential support/resistance zones during trading sessions.
Explore complementary indicator rolesHow it works
The indicator calculates the net percentage change from the previous session's regular trading hours (RTH) close, tracking the price movement between trading sessions. It translates absolute price changes into a percentage format, which allows for easier comparison across different instruments and market conditions.
By converting raw price changes into a percentage, traders can quickly assess the relative movement of an instrument. This method normalizes price changes, making it simple to understand the magnitude of price shifts regardless of the underlying asset's base price.
Why it may be useful
The daily percentage change indicator provides traders with a quick snapshot of market sentiment and potential volatility for a specific instrument. It helps traders understand the recent price momentum and assess whether an asset is experiencing significant movement or remaining relatively stable.
By offering a standardized view of price changes, this indicator can serve as a preliminary screening tool for identifying potentially interesting trading opportunities. It allows traders to make more informed decisions by providing a clear, at-a-glance understanding of recent market behavior.
When to explore it
The indicator is most effective during active trading sessions, particularly for American futures markets where RTH calculations are most precise. Traders can use this signal to gauge market volatility and identify potential support and resistance zones during intraday and short-term trading scenarios.
It works best when combined with other technical analysis tools and used as part of a comprehensive trading strategy. Traders should pay special attention to percentage changes that deviate significantly from an instrument's typical range, as these might signal unusual market conditions or potential trading opportunities.
Keep exploring
What we’ve verified
Access, alerts and repainting behaviour have not been independently verified for this indicator. Check the creator’s current publication and settings.
General descriptions and classifications are recovered research. Verified details above identify the specific checks we have completed. Check the creator’s current publication for later changes.