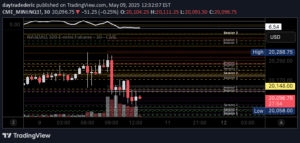
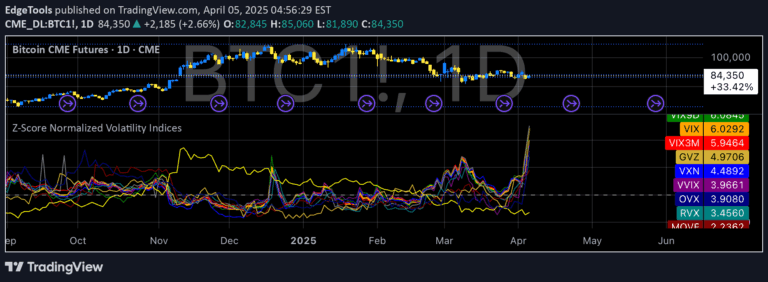
An advanced indicator using ATR and ADR to plot dynamic support and resistance levels, helping traders identify potential price breakouts and trend confirmations across different market conditions.
Explore complementary indicator rolesHow it works
The ATR/ADR Support and Resistance Levels Indicator calculates dynamic price levels using Average True Range (ATR) and Average Daily Range (ADR) calculations. It plots precise support and resistance lines based on daily price data, integrating both open and close prices to enhance accuracy.
Traders can customize the indicator by adjusting the ATR/ADR length, typically using 14 as the standard value. The script also incorporates an Exponential Moving Average (EMA) to help determine market bias, coloring the indicator green when prices are above the average and red when they are below.
Why it may be useful
This indicator provides traders with a sophisticated tool for understanding market volatility and potential price movement zones. By offering dynamic support and resistance levels, it helps traders make more informed decisions about entry and exit points, reducing the risk of trading outside typical market ranges.
The versatility of the ATR/ADR indicator makes it valuable across different trading styles and market conditions. Its ability to adapt to changing market dynamics and provide clear visual cues helps traders identify potential breakouts, trend confirmations, and critical price levels with greater precision.
When to explore it
The ATR/ADR Support and Resistance Levels Indicator is most effective when traders want to understand market volatility and potential price movement boundaries. It works particularly well in markets with consistent trading patterns, where historical price ranges can provide meaningful insights into future price action.
Traders should use this indicator when looking to confirm trend directions, identify potential breakout opportunities, and understand the typical volatility range of a particular financial instrument. It is especially useful during periods of market uncertainty, helping traders make more calculated and informed trading decisions.
Keep exploring
What we’ve verified
Access, alerts and repainting behaviour have not been independently verified for this indicator. Check the creator’s current publication and settings.
General descriptions and classifications are recovered research. Verified details above identify the specific checks we have completed. Check the creator’s current publication for later changes.