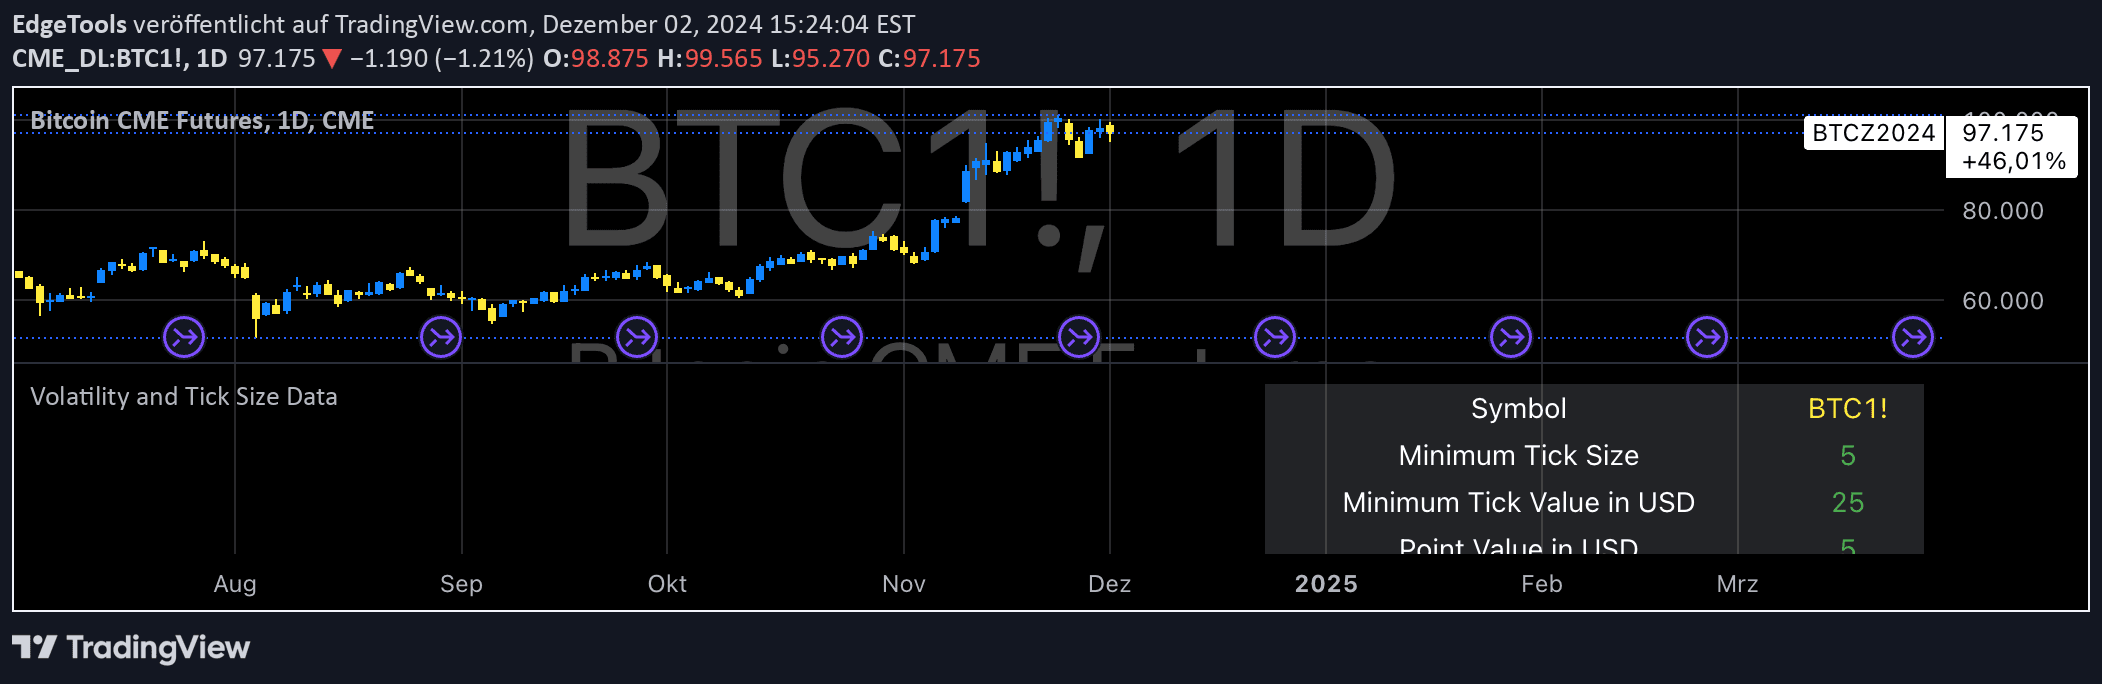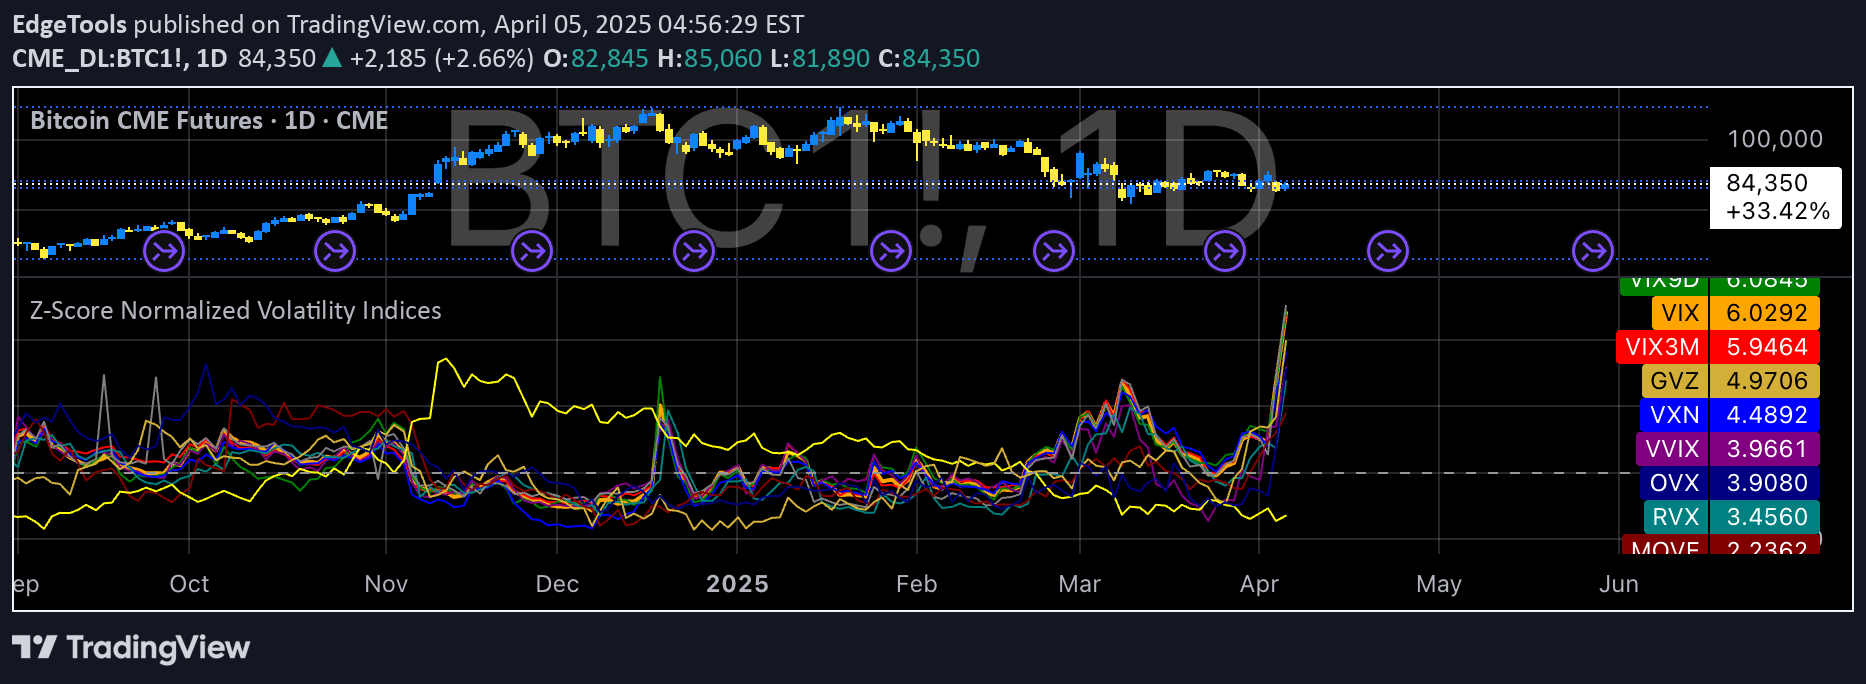
Z-score normalization analyzes volatility indices across multiple markets, transforming raw volatility data into standardized scores to compare market uncertainty and risk levels effectively.
Explore complementary indicator rolesHow it works
The Z-score normalization method calculates how many standard deviations a volatility index is from its mean by subtracting the mean and dividing by the standard deviation. It transforms raw volatility data from indices like VIX, VXN, and MOVE into comparable standardized scores.
By analyzing multiple volatility indices simultaneously, traders can identify relative market uncertainty across different asset classes. The calculation reveals whether current volatility is unusually high or low compared to historical patterns. This statistical technique allows for cross-market volatility comparisons that were previously difficult to interpret
Why it may be useful
Z-score normalization provides traders with a powerful tool to understand market risk and uncertainty across different markets. It allows for objective comparison of volatility indices that originally have different scales and distributions.
Traders can quickly identify abnormal market conditions and potential trading opportunities by seeing how current volatility deviates from historical norms. The method helps in risk management by quantifying market uncertainty in a standardized manner. It enables more informed decision-making by providing a clear, comparative view of market volatility across multiple asset classes
When to explore it
Z-score normalization works best during periods of market transition or potential regime change. It is particularly useful when comparing volatility across different markets like stocks, bonds, cryptocurrencies, and commodities. Traders should apply this technique when seeking to understand relative market risk and potential investment opportunities.
It is most effective during periods of market stress or when comparing volatility across different economic sectors. The method provides valuable insights during market rotations, economic policy changes, and global economic events that might impact multiple asset classes
Keep exploring
What we’ve verified
Access, alerts and repainting behaviour have not been independently verified for this indicator. Check the creator’s current publication and settings.
General descriptions and classifications are recovered research. Verified details above identify the specific checks we have completed. Check the creator’s current publication for later changes.