Linear Regression Channel
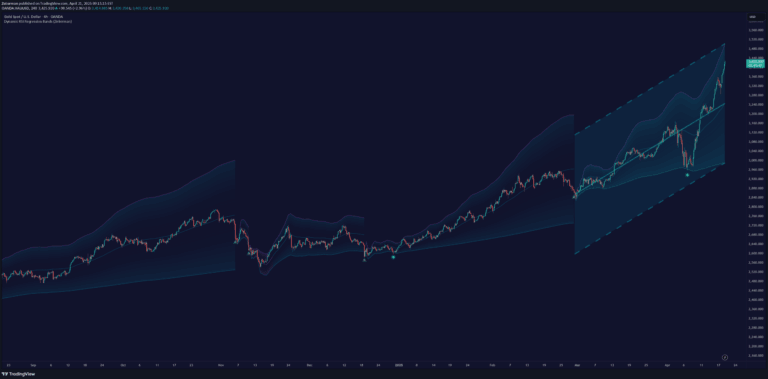
A Linear Regression Channel indicator that tracks price trends, identifies channel breakouts, and analyzes momentum direction using dynamic visual signals and customizable settings.
Explore 11,183 indicators. Filter beyond the obvious.
Discover the tools that fit the way you trade.
11,183 tools to explore
A Linear Regression Channel indicator that tracks price trends, identifies channel breakouts, and analyzes momentum direction using dynamic visual signals and customizable settings.
A depth chart visualizing price liquidity by mapping bullish and bearish price variations, highlighting volume clusters and potential support/resistance zones across trading ranges.
A harmonic pattern detection indicator that identifies Three Drives patterns using multi-length swing detection and Fibonacci ratios to spot potential market reversals.
A market structure indicator that identifies trend shifts by tracking price movements relative to swing highs and lows, helping traders recognize potential trend reversals and continuations.
A Fair Value Gaps (FVG) indicator with volumetric analysis that identifies price zones, shows total volume, and provides bullish/bearish volume ratios for trading insights.
A multi-faceted crypto trading indicator that tracks liquidation ranges, volume/OI dots, and identifies high-volume price areas using advanced volume and open interest analysis.
An order block indicator that identifies key price accumulation zones, helping traders spot potential entry and exit points by highlighting supply and demand areas on the chart.
A Fibonacci-based trading signal using SMA bands to identify short-term reversals in market direction. Helps traders spot potential entry and exit points during ranging market conditions.
An advanced trading indicator that identifies liquidity levels, sweeps, and breakouts across multiple timeframes, helping traders spot potential market movements and liquidation opportunities.
A dynamic VWAP-based indicator that identifies institutional supply and demand zones using volume and momentum confirmation, helping traders spot potential market reversals and continuations.
ABCD Projection Indicator identifies and projects ABCD chart patterns using a Zigzag-based approach, helping traders spot potential trend continuation opportunities in financial markets.
A dynamic RSI-based regression channel that adapts to market momentum by resetting its trend analysis when RSI crosses overbought or oversold levels, revealing potential trend shifts.
Likes, views, and comments are historical TradingView snapshots. They describe attention, not trading performance.