
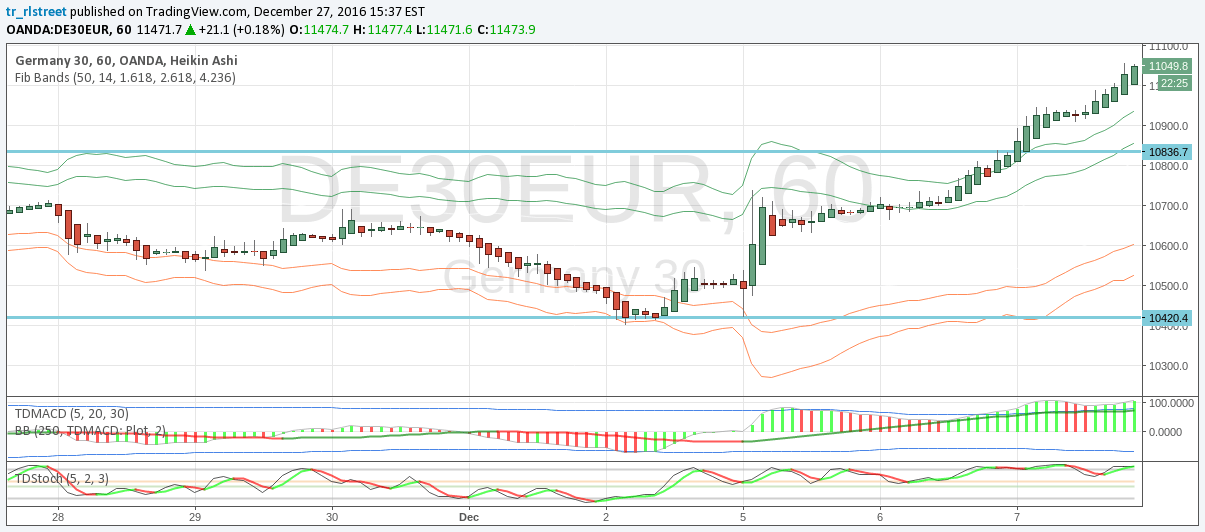
A Fibonacci-based trading signal using SMA bands to identify short-term reversals in market direction. Helps traders spot potential entry and exit points during ranging market conditions.
Explore complementary indicator rolesHow it works
The indicator creates bands based on Fibonacci numbers and Simple Moving Average (SMA). It analyzes market conditions by plotting multiple bands that represent different volatility levels. Traders observe price movements relative to these bands, looking for specific interactions like closing outside and then returning inside the bands.
The method involves identifying a limiting band that represents the typical volatility range for a specific instrument. When price breaks and then returns within this band, it signals a potential trading opportunity
Why it may be useful
This signal provides traders with a structured approach to identifying potential market reversals and entry points. By combining Fibonacci principles with moving average analysis, it offers a nuanced view of market dynamics.
The method helps traders understand underlying price movements and volatility patterns. It reduces emotional decision-making by providing clear, rule-based entry and exit criteria. The approach is particularly useful for managing risk and identifying high-probability trading opportunities
When to explore it
Best applied in ranging market conditions where price oscillates between defined levels. Most effective when used across multiple timeframes, such as 15 and 55-minute charts. Traders should confirm signals on both short and long-term charts for increased reliability.
Works well when seeking short-term reversals aligned with the major trend. Particularly useful for instruments with consistent volatility ranges. Requires careful identification of the limiting band and precise entry and exit criteria
Keep exploring
What we’ve verified
Access, alerts and repainting behaviour have not been independently verified for this indicator. Check the creator’s current publication and settings.
General descriptions and classifications are recovered research. Verified details above identify the specific checks we have completed. Check the creator’s current publication for later changes.


