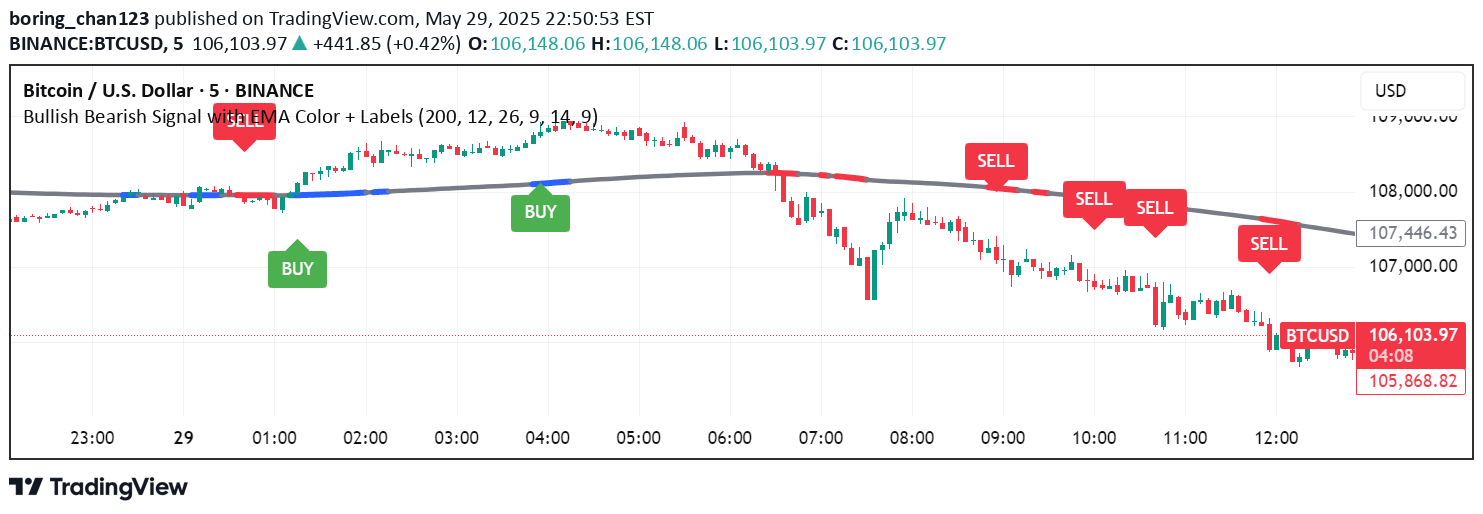
A multi-indicator trading strategy using EMA 200, MACD, and RSI to generate precise buy and sell signals by analyzing trend direction, momentum, and market conditions.
Explore complementary indicator rolesHow it works
The trading signal combines three key technical indicators to generate precise market entry and exit points. The EMA 200 provides a long-term trend filter by assessing price position relative to the moving average, creating a foundational trend bias. The MACD indicator detects momentum shifts by analyzing the crossover between the MACD line and signal line, indicating potential trend reversals.
RSI adds an additional confirmation layer by measuring price momentum and identifying overbought or oversold conditions. When these three indicators align - with price above/below EMA 200, MACD crossing, and RSI confirming the momentum - a clear buy or sell signal is generated, providing traders with a comprehensive market analysis tool.
Why it may be useful
This multi-indicator strategy provides traders with a robust and systematic approach to market analysis by combining trend, momentum, and confirmation signals. By integrating multiple technical indicators, traders can reduce false signals and increase the probability of successful trades. The comprehensive approach helps mitigate individual indicator limitations by requiring confirmation from different analytical perspectives.
The strategy's strength lies in its ability to filter out noise and provide clear, actionable signals based on multiple technical criteria. Traders can gain increased confidence in their trading decisions by using a method that considers long-term trends, short-term momentum, and additional momentum confirmation.
When to explore it
This trading signal is most effective in trending markets with clear directional movements, particularly on higher timeframes such as 1-hour and above. The strategy works best in markets with moderate volatility, where price trends are more defined and indicators can provide more reliable signals. Traders should prioritize using this approach in liquid markets with consistent price action.
The signal is particularly useful for traders seeking a systematic, rule-based approach to market analysis. It is recommended for intermediate to advanced traders who understand technical indicators and can interpret complex signal interactions. Traders should always combine this strategy with proper risk management techniques and avoid using it as the sole basis for trading decisions.
Keep exploring
What we’ve verified
Access, alerts and repainting behaviour have not been independently verified for this indicator. Check the creator’s current publication and settings.
General descriptions and classifications are recovered research. Verified details above identify the specific checks we have completed. Check the creator’s current publication for later changes.