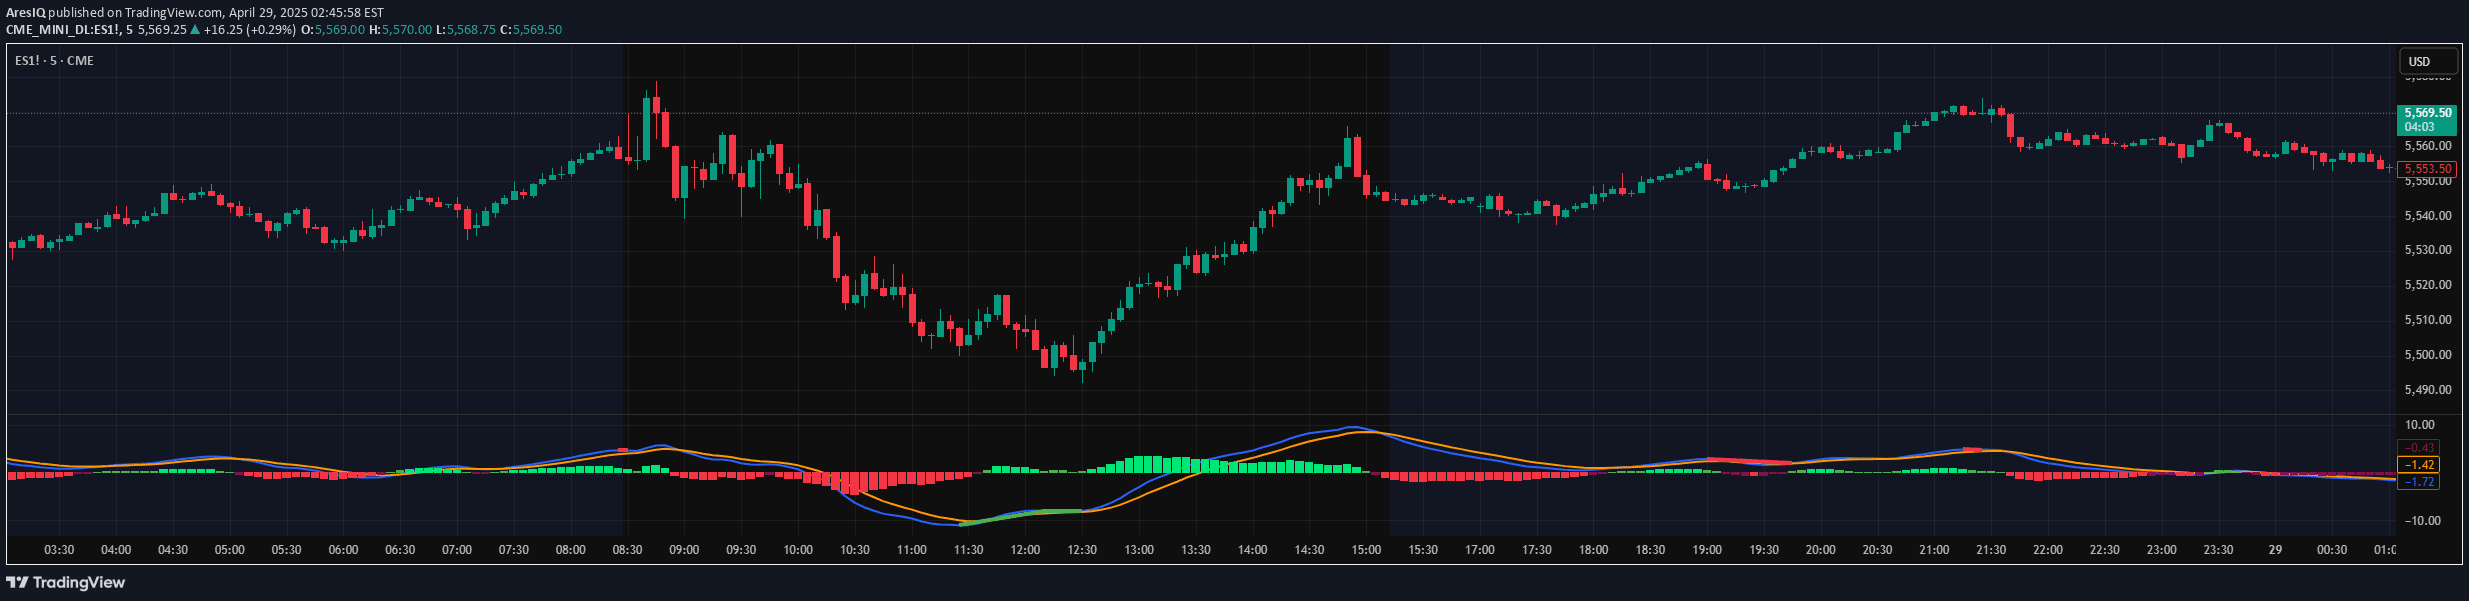
A comprehensive technical analysis tool combining weighted moving averages, ATR bands, and CCI to identify trend changes, momentum shifts, and potential trading opportunities across different market conditions.
Explore complementary indicator rolesHow it works
The Momentum_Trader_WMA indicator integrates multiple technical analysis components to provide a comprehensive market view. It calculates two weighted moving averages (WMAs) with customizable lengths, generating a smoothed representation of price data and identifying potential trend directions.
Simultaneously, the indicator employs Average True Range (ATR) bands to measure market volatility and Commodity Channel Index (CCI) to assess momentum. The CCI tracks price change strength, while an exponential moving average of CCI helps traders recognize trend shifts and momentum transitions more effectively.
Why it may be useful
The indicator offers traders a multi-dimensional perspective on market dynamics by combining trend, momentum, and volatility measurements. By integrating WMAs, ATR bands, and CCI, traders can gain deeper insights into potential market movements and make more informed trading decisions.
Its color-coded visualization and customizable settings allow traders to adapt the tool to various market conditions and personal trading strategies. The comprehensive approach helps identify potential entry and exit points, assess trend strength, and recognize early signals of market transitions.
When to explore it
The Momentum_Trader_WMA is most effective in markets with clear trending characteristics, where price movements show consistent directional momentum. Traders can leverage this indicator in both bullish and bearish market environments, using its multiple components to confirm potential trading opportunities.
The indicator performs optimally when combined with additional technical analysis tools like support and resistance levels. Traders should pay special attention to WMA middle line color changes, CCI dot signals, and ATR band expansions to validate potential trend shifts and momentum changes.
Keep exploring
What we’ve verified
Access, alerts and repainting behaviour have not been independently verified for this indicator. Check the creator’s current publication and settings.
General descriptions and classifications are recovered research. Verified details above identify the specific checks we have completed. Check the creator’s current publication for later changes.