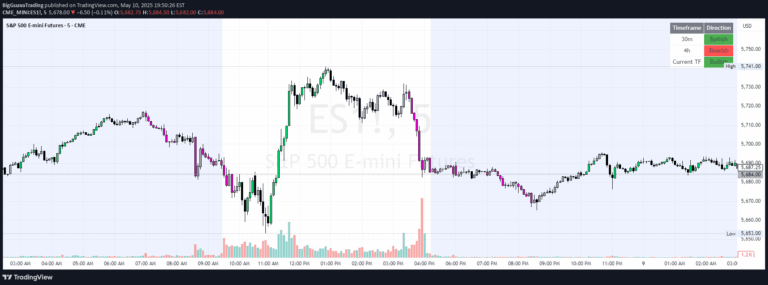
An adaptive trend projection indicator that uses linear regression to dynamically analyze market trends, providing sophisticated trend strength, direction, and future projection insights.
Explore complementary indicator rolesHow it works
The Adaptive Trend Projection indicator operates by applying linear regression techniques across multiple length intervals from 20 to 200. It calculates key statistical metrics including slope, average, and intercept for each selected length to determine trend characteristics and strength. By dynamically adjusting the projection length, the indicator can adapt to changing market conditions and provide a more responsive analysis.
The indicator goes beyond basic trend analysis by computing advanced statistical measures like standard deviation and Pearson's correlation coefficient. These calculations help generate confidence levels that categorize the trend's reliability, ranging from Neutral to Ultra High, allowing traders to quickly assess the robustness of the projected trend direction and potential future movement.
Why it may be useful
Traditional trend indicators often provide static or lagging insights, but the Adaptive Trend Projection offers a more nuanced and dynamic approach to market analysis. By intelligently adjusting its projection length and incorporating sophisticated statistical techniques, the indicator provides traders with a more comprehensive understanding of market dynamics and trend potential.
The ability to calculate confidence levels and dynamically forecast future trend points makes this indicator particularly valuable. Traders can gain deeper insights into market behavior, assess trend strength more accurately, and make more informed trading decisions based on a multi-dimensional analysis of price movement and statistical probability.
When to explore it
The Adaptive Trend Projection indicator is most effective in markets experiencing clear directional movements with consistent underlying trends. It performs exceptionally well in financial instruments that display more predictable price behavior, such as major currency pairs, large-cap stocks, and established market indices where linear regression techniques can more reliably capture trend characteristics.
Traders should utilize this indicator during periods of sustained market trends, avoiding choppy or highly volatile market conditions where statistical projections may become less reliable. It is particularly useful when combined with other confirmation indicators, helping traders validate trend strength, identify potential entry and exit points, and develop more robust trading strategies across different timeframes.
Keep exploring
What we’ve verified
Access, alerts and repainting behaviour have not been independently verified for this indicator. Check the creator’s current publication and settings.
General descriptions and classifications are recovered research. Verified details above identify the specific checks we have completed. Check the creator’s current publication for later changes.