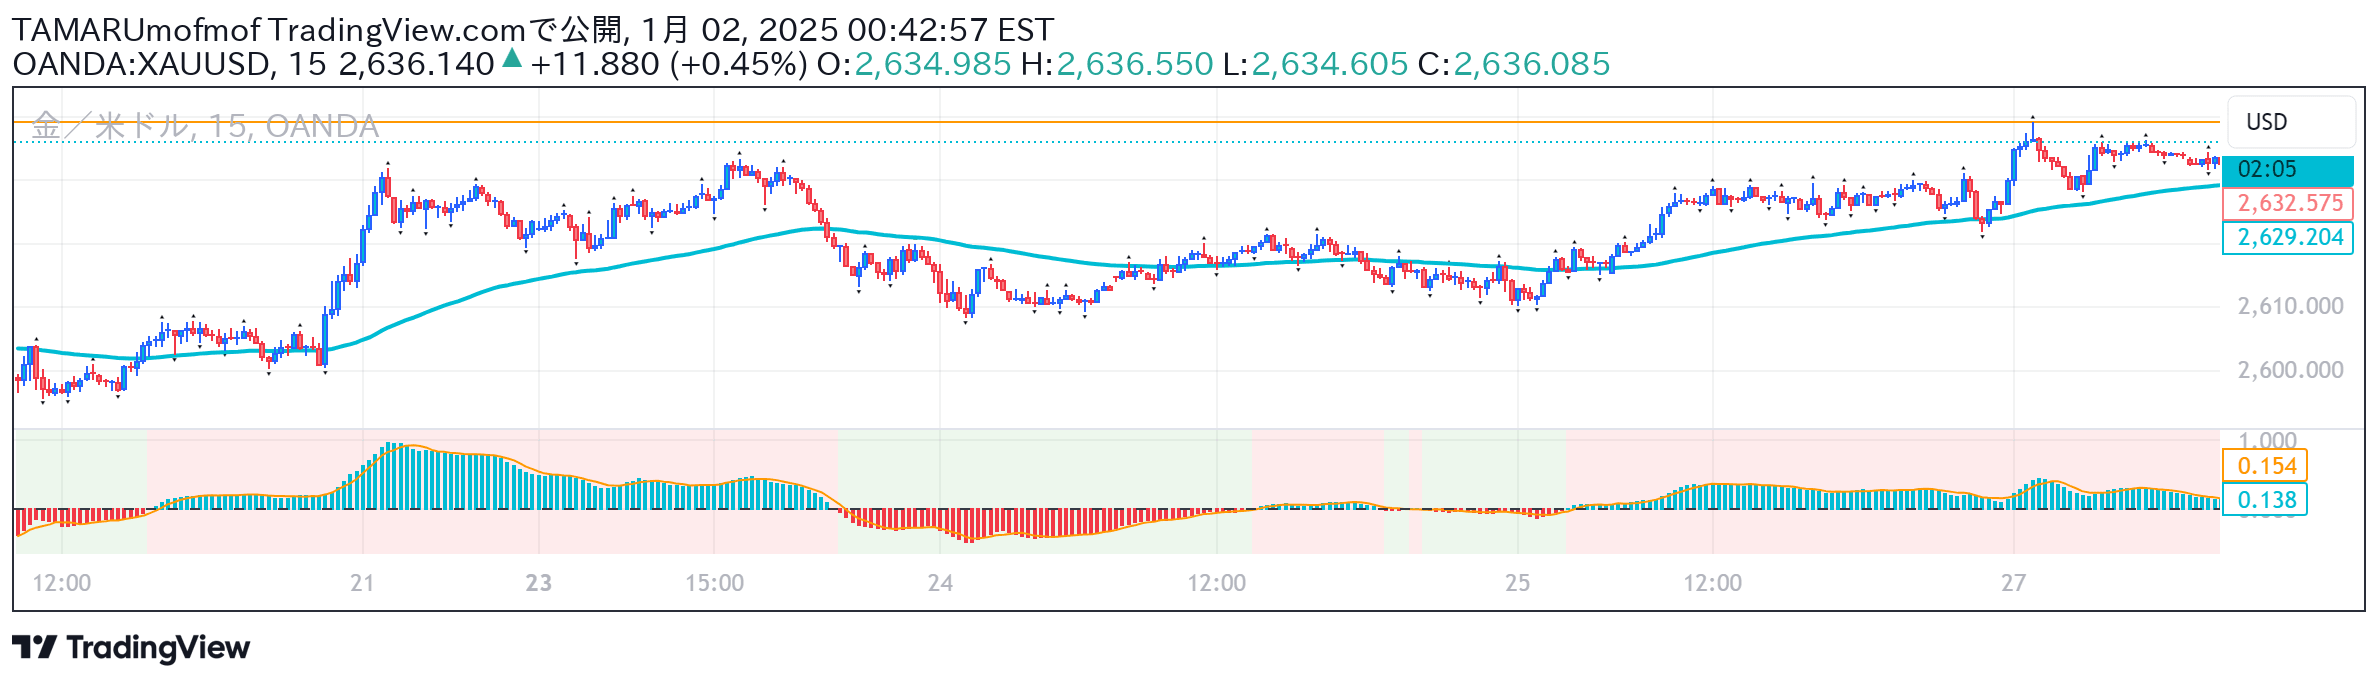
A dynamic trading script that identifies market turning points and trend continuations by plotting two lines and a central histogram within a cyclic envelope.
Explore complementary indicator rolesHow it works
The script calculates a sophisticated oscillator using exponential moving averages blended with a root mean square (RMS) analysis over a specified number of bars. It creates a central line with two outer boundaries that represent overbought and oversold conditions, forming a dynamic cyclic envelope that tracks price movements.
The indicator uses fast and slow periods to adjust its sensitivity, with shorter periods providing quicker reactions to price changes and longer periods offering smoother trend representations. The RMS length controls the range of the cyclic envelope, which determines the trigger levels for potential trading signals.
Why it may be useful
This trading script provides traders with a powerful tool for understanding market dynamics by visualizing potential trend reversals and continuations in a clear, intuitive manner. By mapping out cyclic market movements, it helps traders identify key turning points and momentum shifts that might be missed by traditional analysis methods.
The dynamic nature of the oscillator allows traders to adapt to changing market conditions, offering insights into both trending and ranging markets. Its multi-layered approach of using moving averages and RMS analysis creates a more nuanced view of price action compared to single-indicator strategies.
When to explore it
The Dynamic Cycle Oscillator works best in markets with clear cyclical patterns and moderate volatility, where price movements show discernible trends and potential reversal points. It is particularly effective in identifying early signs of trend changes and providing confirmation of potential entry and exit points across various financial instruments.
Traders should apply this indicator in conjunction with other technical analysis tools to validate signals and reduce false positives. It is most valuable when used on timeframes that match the trader's strategy, from short-term scalping to longer-term swing trading, and can be applied to stocks, forex, commodities, and cryptocurrencies.
Keep exploring
What we’ve verified
Access, alerts and repainting behaviour have not been independently verified for this indicator. Check the creator’s current publication and settings.
General descriptions and classifications are recovered research. Verified details above identify the specific checks we have completed. Check the creator’s current publication for later changes.