
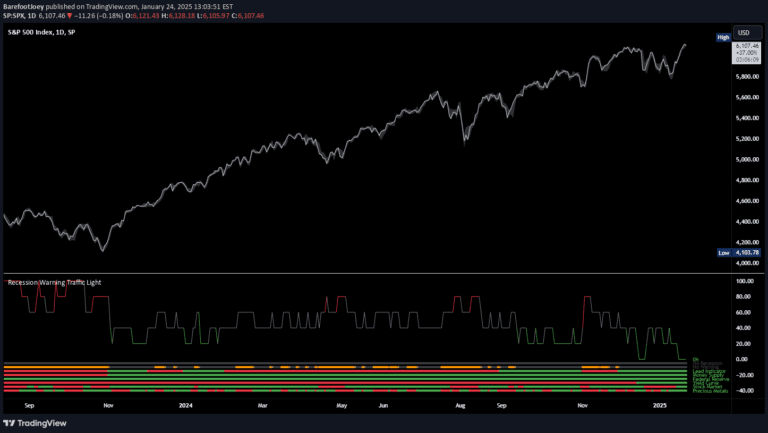
Recession Warning Traffic Light
A multi-metric recession probability indicator using six key economic factors to assess potential economic downturns by analyzing various financial and market signals.
Explore 11,183 indicators. Filter beyond the obvious.
Discover the tools that fit the way you trade.
11,183 tools to explore
A multi-metric recession probability indicator using six key economic factors to assess potential economic downturns by analyzing various financial and market signals.
A widget tracking yield curve dynamics, allowing traders to compare current and historical yield curves and detect potential market inversions with a simple visual interface.
Treasury Yields Heatmap is a dynamic tool tracking bond values and yield curve status across different countries using Pearson's linear regression coefficient.
A yield curve analysis tool that tracks the relationship between 10-year and 2-year Treasury yields to identify potential economic shifts and market trends.
Global Yield Spread is an advanced economic indicator that analyzes bond yields across multiple countries to assess market conditions and potential investment opportunities.
A comprehensive visualization of U.S. Treasury Securities Yield Curve, displaying current and previous yield curves to help traders understand interest rate dynamics and market sentiment.
A yield spread indicator comparing 10-year and 2-year US Treasury bond yields, providing insights into potential economic recessions and market corrections.
A comprehensive yield curve indicator tracking U.S. Treasury Securities across multiple maturities, providing insights into potential market movements and economic conditions.
Calculates and displays the yield difference between bond pairs in specific countries, providing insights into bond market dynamics and potential economic trends.
Bond Breadth Signal identifies major market turning points by analyzing bond yields, market breadth, and volatility indicators to pinpoint high-confidence trading opportunities.
A yield curve ratio indicator tracking the relationship between 1-Year and 10-Year US Treasury Yields, visualizing potential economic shifts and market sentiment through rate comparisons.
Likes, views, and comments are historical TradingView snapshots. They describe attention, not trading performance.