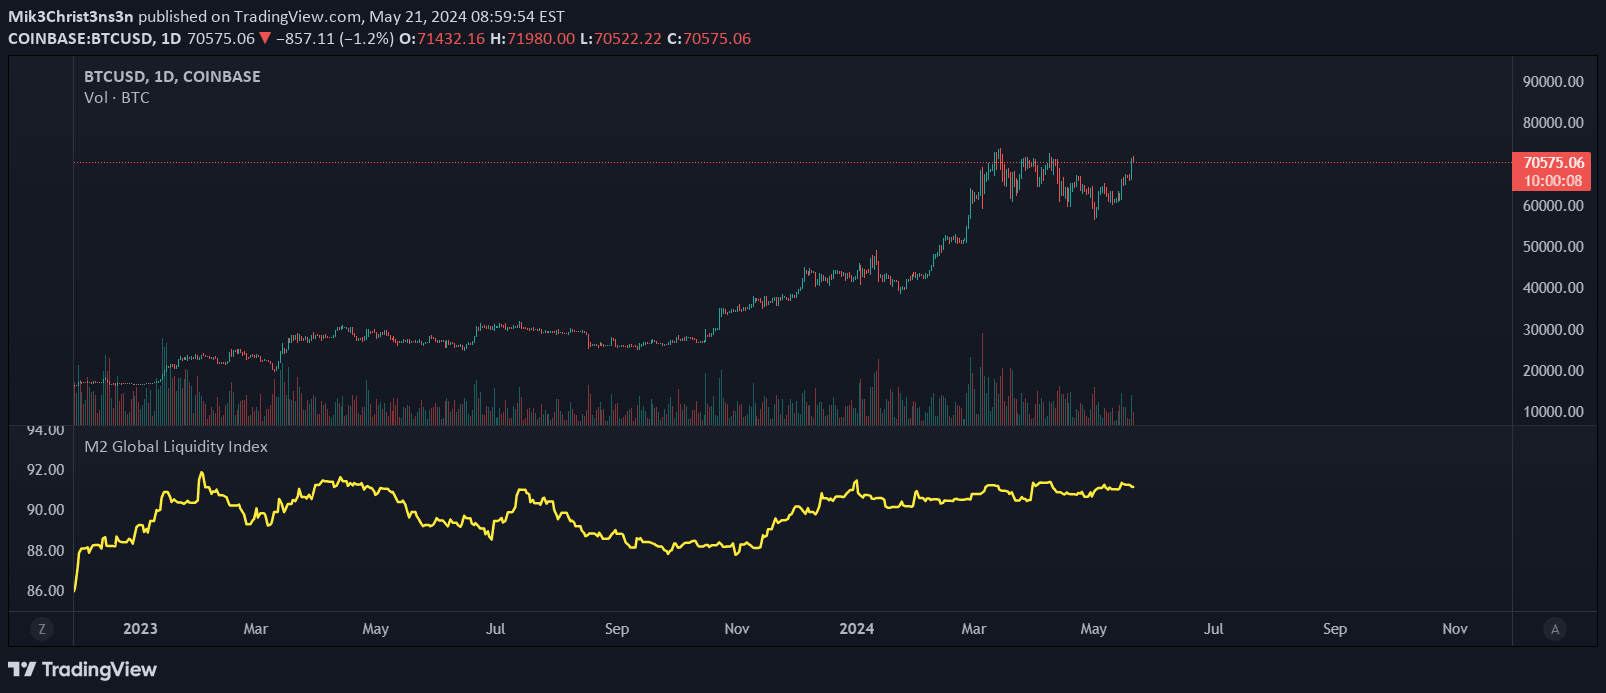
An advanced liquidity indicator that combines macroeconomic factors to estimate market trends by analyzing global money supply, central bank balance sheets, and economic indicators.
Explore complementary indicator rolesHow it works
The Excess Liquidity Indicator operates by aggregating multiple macroeconomic data points to create a comprehensive liquidity measurement. It combines global M2 money supply, central bank balance sheet expansions, and key economic indicators like interest rates, oil prices, and dollar index performance to generate a holistic view of market liquidity.
By subtracting worldwide GDP from these aggregated metrics, the indicator calculates a normalized liquidity score that helps traders understand underlying market dynamics. The resulting metric provides insight into potential market movements driven by monetary and economic conditions beyond traditional price-based analysis.
Why it may be useful
Excess liquidity is a critical factor in understanding market movements, as it directly influences asset prices and investment flows. By tracking macroeconomic liquidity trends, traders can gain insights into potential market shifts before they become apparent through traditional technical analysis methods.
The indicator offers a strategic perspective on how global monetary conditions might impact different asset classes, helping traders make more informed decisions. It provides a broader economic context that goes beyond individual asset performance, allowing for more nuanced and comprehensive market analysis.
When to explore it
The Excess Liquidity Indicator is most effective during periods of significant economic transitions, such as monetary policy changes, global economic shifts, or central bank interventions. Traders can utilize this tool when seeking to understand broader market trends that might not be immediately visible through price action alone.
It is particularly valuable during times of economic uncertainty, when traditional market indicators might provide incomplete or misleading signals. Investors and traders can use this indicator to complement their existing analysis, gaining a more comprehensive view of potential market movements driven by global liquidity conditions.
Keep exploring
What we’ve verified
Access, alerts and repainting behaviour have not been independently verified for this indicator. Check the creator’s current publication and settings.
General descriptions and classifications are recovered research. Verified details above identify the specific checks we have completed. Check the creator’s current publication for later changes.