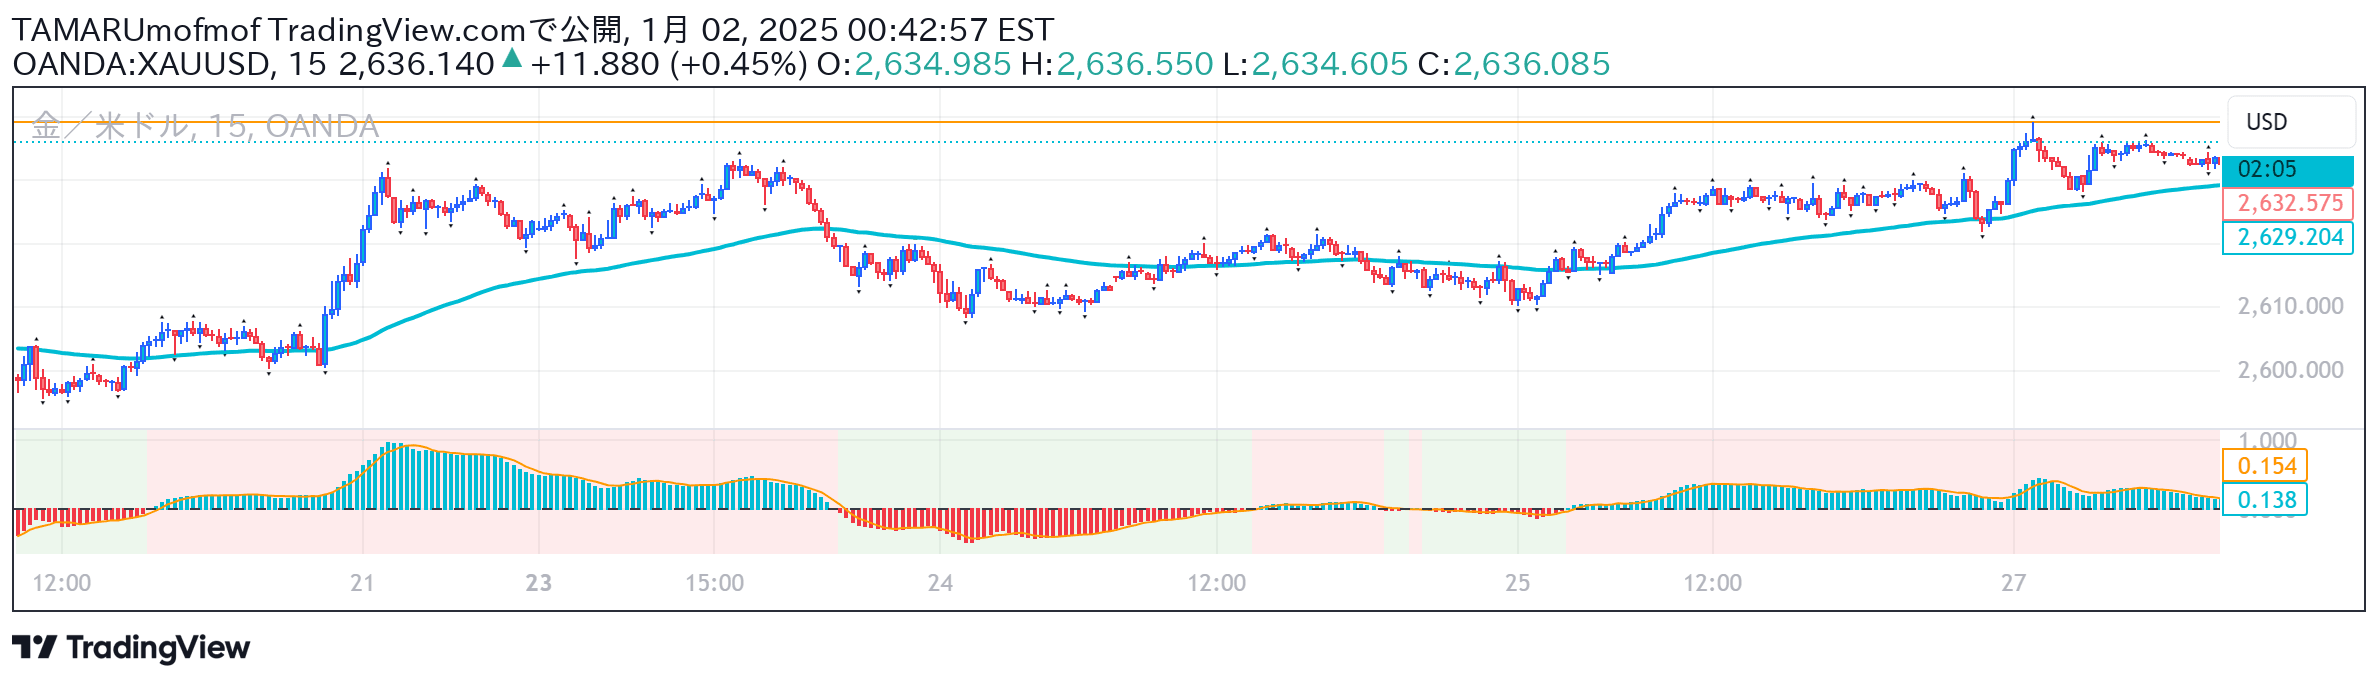
A Bitcoin trading indicator combining Pi Cycle and MACD techniques to analyze market trends, featuring an inverse oscillator that dynamically tracks moving average relationships and momentum.
Explore complementary indicator rolesHow it works
The Pi Cycle MACD Inverse Oscillator operates by comparing two moving averages (350 MA and 111 MA) and normalizing their relationship on a scale from -1 to 1. As the moving averages change, the oscillator calculates their relative position, with 1 representing equal moving averages and -1 representing the maximum observed distance between them.
The indicator uses a configurable scaling factor to dynamically adjust to price fluctuations, creating a responsive visualization of market momentum. It incorporates a color gradient that transitions from green to yellow to red, providing traders with an intuitive visual representation of the oscillator's current state and market trend.
Why it may be useful
The Pi Cycle MACD Inverse Oscillator provides traders with a comprehensive tool for understanding complex market dynamics by synthesizing multiple analytical perspectives into a single, easy-to-interpret indicator. By combining trend, momentum, and moving average analysis, it offers a nuanced view of market conditions that goes beyond traditional single-metric indicators.
The oscillator's unique design allows traders to quickly assess market momentum, potential reversal points, and trend strength through its color-coded gradient and normalized scaling. This approach helps traders make more informed decisions by providing a holistic view of market behavior that integrates short-term and long-term trend information.
When to explore it
This indicator is most effective in volatile markets with significant price movements, particularly for Bitcoin trading where trend identification can be challenging. It works best when traders want to understand both short-term momentum and long-term trend direction simultaneously, making it valuable during periods of market transition or uncertainty.
Traders should utilize this oscillator when seeking to identify potential trend reversals, confirm existing market trends, and gain insights into the market's cyclical behavior. It is particularly useful for day traders and swing traders who need a comprehensive tool that can provide both immediate market insights and broader trend analysis.
Keep exploring
What we’ve verified
Access, alerts and repainting behaviour have not been independently verified for this indicator. Check the creator’s current publication and settings.
General descriptions and classifications are recovered research. Verified details above identify the specific checks we have completed. Check the creator’s current publication for later changes.