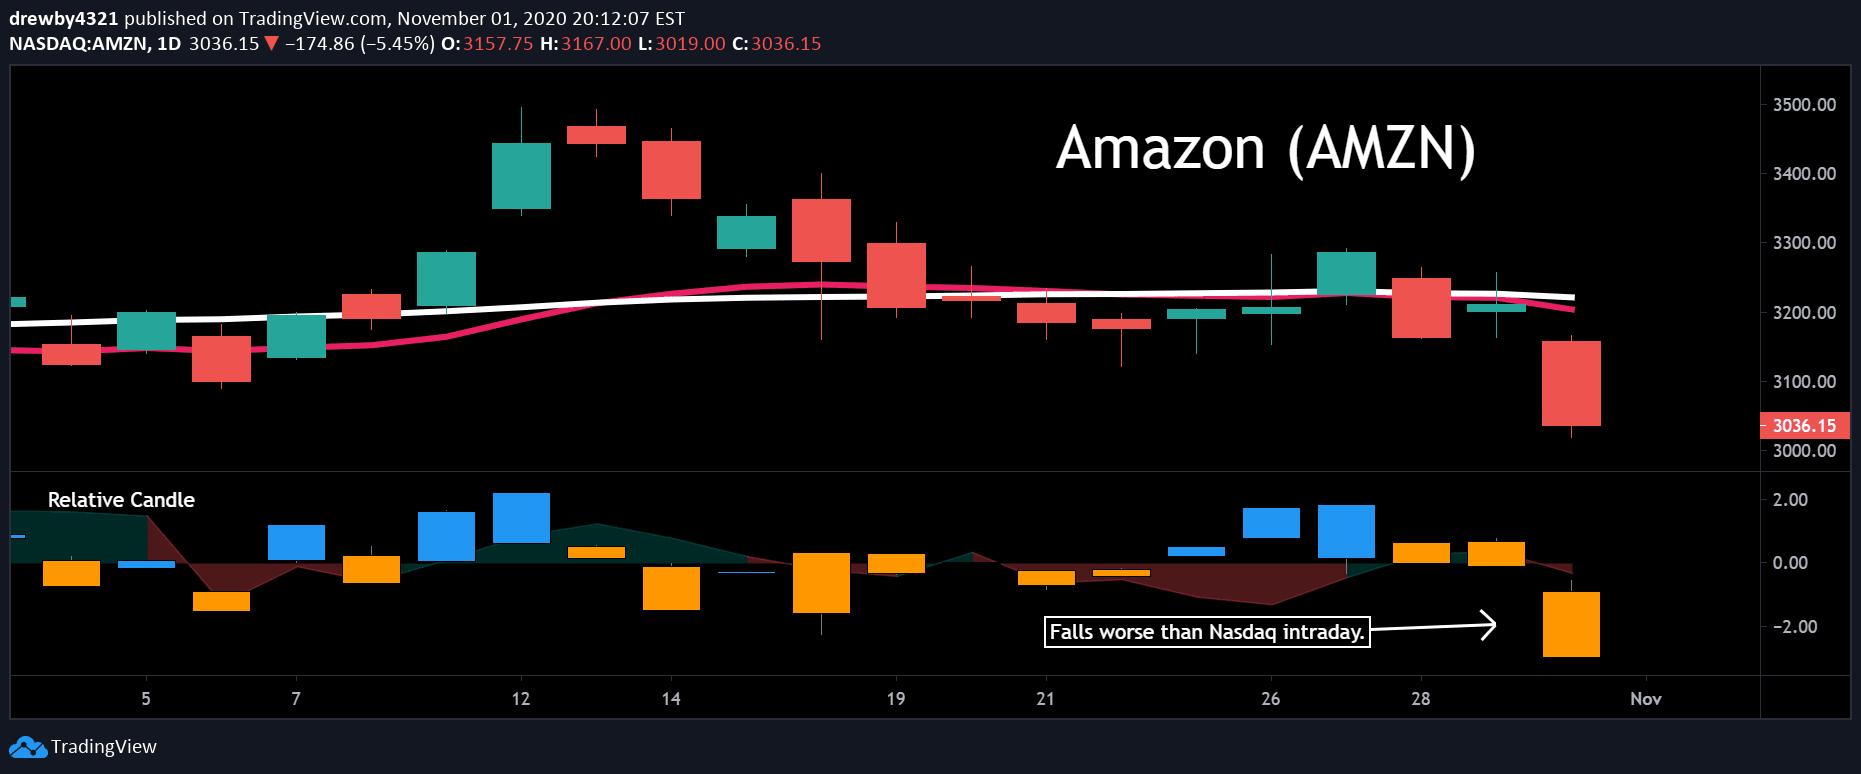
A visual indicator comparing a specific stock's daily performance against a market index, revealing relative price movements and potential anomalies in trading behavior.
Explore complementary indicator rolesHow it works
The indicator plots a single stock's OHLC candle relative to an index's performance, using vertical positioning to show comparative price movement. The candle's color indicates how the stock moved in relation to the index, with green or red signaling different performance levels.
The candle's wick demonstrates the closing range comparison between the stock and the index. A background area graph displays a 10-day simple moving average of relative closes, providing additional context for performance tracking
Why it may be useful
This visualization helps traders quickly identify whether a stock's price movement is driven by broader market trends or specific stock-related factors. By comparing individual stock performance against an index, traders can distinguish between systematic market pullbacks and stock-specific price actions.
The visual representation allows rapid interpretation of relative performance, enabling more informed trading decisions and better understanding of market dynamics
When to explore it
This indicator is most effective during periods of market volatility or when analyzing stocks within a specific sector or index. It works best for traders seeking to understand nuanced price movements beyond simple price charts.
Ideal for identifying stocks that outperform or underperform their benchmark index, especially during market shifts. Particularly useful for day traders and swing traders monitoring short to medium-term market behaviors
Keep exploring
What we’ve verified
Access, alerts and repainting behaviour have not been independently verified for this indicator. Check the creator’s current publication and settings.
General descriptions and classifications are recovered research. Verified details above identify the specific checks we have completed. Check the creator’s current publication for later changes.