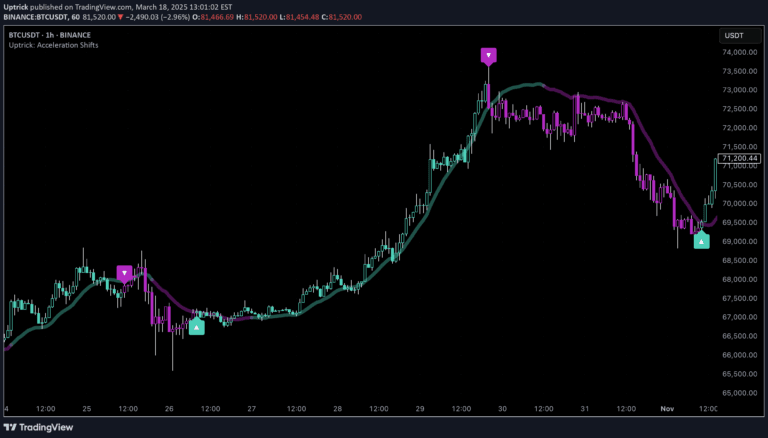
A multi-layered trend indicator using smoothed moving averages that creates a density cloud to visualize market momentum and potential reversals through color-coded bars and triangles.
Explore complementary indicator rolesHow it works
The Uptrick Signal Density Cloud generates two smoothed lines using multiple moving average techniques like exponential, simple, hull, and an optimized blend. These lines track market direction and create a color-filled cloud between them, representing the momentum and relationship between short-term and long-term price tendencies.
By calculating the absolute difference between these lines and applying a thickness threshold, the indicator determines bullish or bearish conditions. When the lines cross in thick cloud zones, small triangles appear to signal potential trend reversals, providing traders with visual cues about market dynamics and potential shifts in momentum.
Why it may be useful
This indicator simplifies complex market analysis by combining multiple technical concepts into a single, intuitive visualization. It offers traders an immediate understanding of trend direction, momentum strength, and potential reversal points through color-coded bars, a density cloud, and strategic triangle markers.
The multi-layered approach helps reduce market noise and provides a comprehensive view of price movement. By blending different smoothing methods and offering customizable parameters, the indicator adapts to various market conditions and trading styles, making it a versatile tool for traders seeking both quick snapshots and deeper market insights.
When to explore it
The Uptrick Signal Density Cloud is most effective in trending markets with clear directional movement, where momentum and trend changes are more pronounced. It works particularly well in timeframes ranging from intraday to weekly charts, allowing traders to adjust its sensitivity to match their specific trading strategy and market characteristics.
Traders should use this indicator in conjunction with other analytical tools, especially during periods of established trend momentum. It is particularly useful when seeking to identify potential trend reversals, assess momentum strength, and gain a visual representation of market dynamics across different asset classes like stocks, forex, commodities, and cryptocurrencies.
Keep exploring
What we’ve verified
Access, alerts and repainting behaviour have not been independently verified for this indicator. Check the creator’s current publication and settings.
General descriptions and classifications are recovered research. Verified details above identify the specific checks we have completed. Check the creator’s current publication for later changes.