
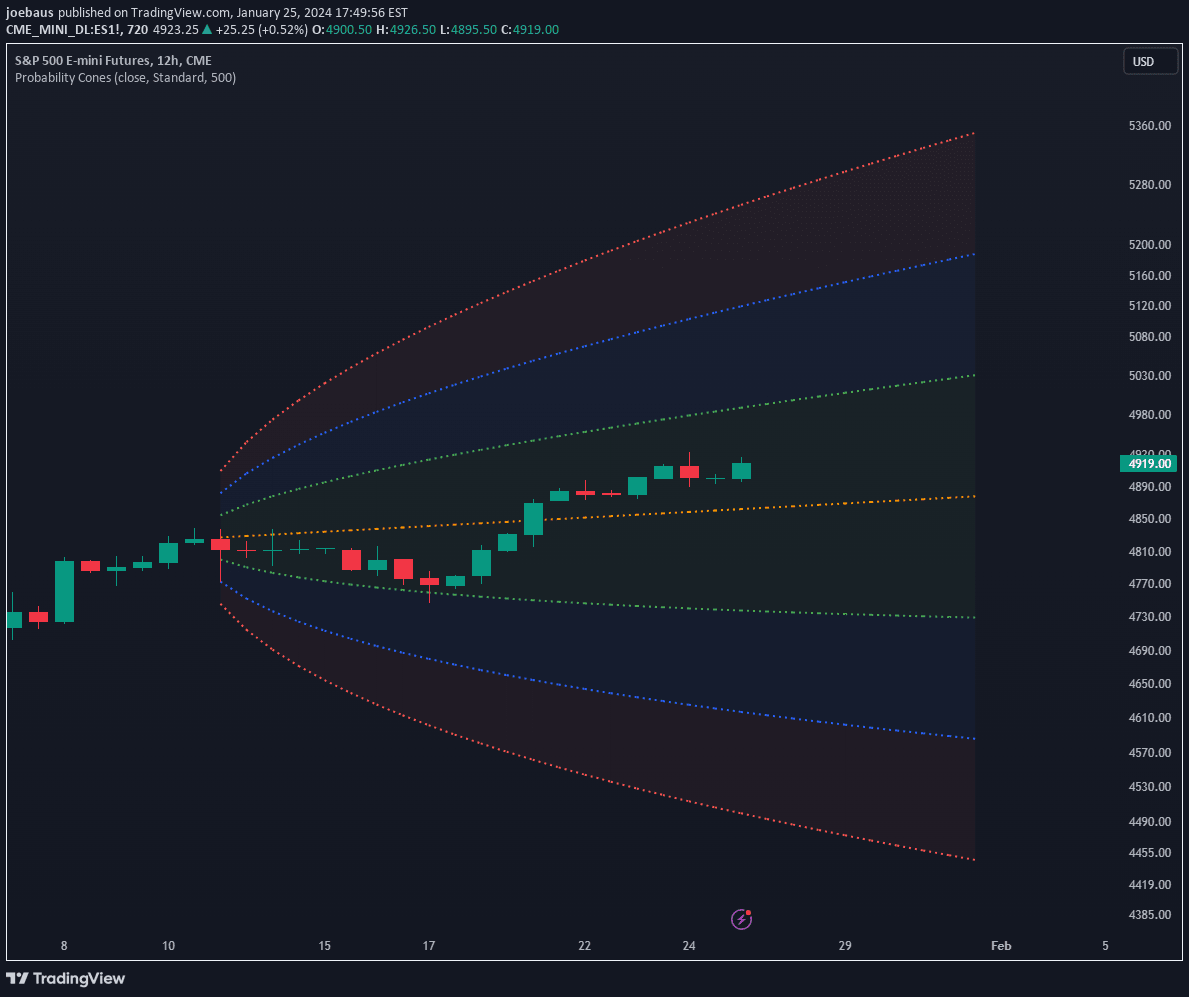
A probability cone is a statistical forecast indicator that visualizes potential price distribution using standard or Laplace distributions, helping traders understand potential price movement ranges.
Explore complementary indicator rolesHow it works
The probability cone indicator calculates potential price distribution by sampling historical price data and creating statistical projections. It generates cones from a specific origin point, using either standard or Laplace distribution models. Traders can customize the lookback period, forecast duration, and deviation levels.
The cones visually represent potential price ranges, with different deviation levels showing varying probabilities of price movement. The indicator allows users to adjust parameters like cone anchoring, visibility, and line styles to suit their analytical needs
Why it may be useful
Probability cones provide traders with a statistical framework for understanding potential price movements. They offer visual insights into price distribution, helping traders assess potential market behavior. The cones help identify areas of likely price concentration and potential reversal zones.
By showing different deviation levels, traders can gauge the probability of price staying within specific ranges. This statistical approach adds a quantitative dimension to technical analysis, enabling more informed trading decisions and risk management strategies
When to explore it
Probability cones work best at the beginning of calendar periods like months, weeks, or days. They are most effective when combined with momentum indicators to confirm potential price movements. Traders should use them when seeking a statistical perspective on potential price ranges.
They are particularly useful during periods of market uncertainty or when analyzing potential trend continuations or reversals. Caution is advised when using different timeframes, as lookback settings can vary based on the current chart's timeframe
Keep exploring
What we’ve verified
Access, alerts and repainting behaviour have not been independently verified for this indicator. Check the creator’s current publication and settings.
General descriptions and classifications are recovered research. Verified details above identify the specific checks we have completed. Check the creator’s current publication for later changes.


