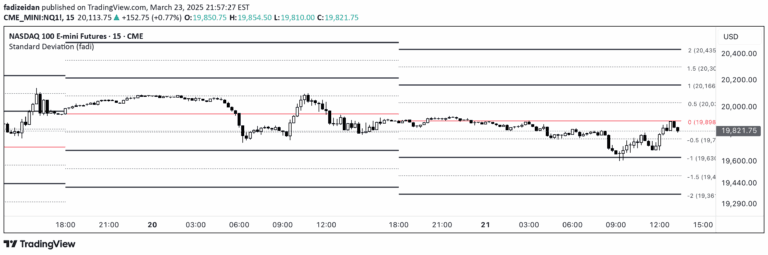
A statistical OHLC projection tool that breaks down price movement into manipulation and distribution levels, helping traders understand potential market dynamics across different timeframes.
Explore complementary indicator rolesHow it works
The Statistical OHLC Projections indicator analyzes historical price candles to identify manipulation and distribution levels. It calculates statistical boundaries by examining the open, high, low, and close prices across a selected lookback period.
The tool breaks down price movement into two key areas: manipulation levels representing potential liquidity grabs, and distribution levels showing primary directional movement. Traders can customize the lookback period, timeframe, and display mode to suit their analysis. The indicator uses historical data to project potential price movement zones, helping traders understand market structure and potential turning points
Why it may be useful
This indicator provides traders with a sophisticated approach to understanding market structure and potential price movement. By breaking down historical price action into manipulation and distribution levels, traders gain insights into market psychology and potential liquidity zones. The tool helps identify potential reversal points and areas of price concentration.
It offers flexibility through customizable settings, allowing traders to adapt the analysis to different market conditions and trading styles. The indicator can help traders make more informed decisions by providing a statistical view of historical price behavior and potential future movement patterns
When to explore it
The Statistical OHLC Projections indicator works best when analyzing markets with clear historical price patterns. It is particularly useful for traders looking to understand market structure on higher timeframes like daily or weekly charts. Traders should use this tool when seeking to identify potential reversal zones, liquidity grab areas, and directional movement patterns.
It is most effective when combined with other technical analysis tools and when used on markets with sufficient historical data. The indicator can be particularly valuable for swing traders and day traders looking to gain a deeper understanding of price dynamics
Keep exploring
What we’ve verified
Access, alerts and repainting behaviour have not been independently verified for this indicator. Check the creator’s current publication and settings.
General descriptions and classifications are recovered research. Verified details above identify the specific checks we have completed. Check the creator’s current publication for later changes.