Liquidations Meter [LuxAlgo]
A dynamic tool that analyzes potential liquidation points in trading, measuring market momentum, identifying trader positioning, and highlighting potential reversal zones.
Explore 11,183 indicators. Filter beyond the obvious.
Discover the tools that fit the way you trade.
11,183 tools to explore
A dynamic tool that analyzes potential liquidation points in trading, measuring market momentum, identifying trader positioning, and highlighting potential reversal zones.
A data visualization tool that helps traders analyze the distribution of numerical data by dividing it into bins and calculating the percentage of data points in each range.
An advanced Open Interest indicator that maps potential liquidation zones across multiple trading platforms by analyzing anomalies in trading data.
A trading tool that detects stop-loss cascades by analyzing price momentum and volume spikes, revealing potential market turning points and explosive price movements.
A trading signal that uses RSI, EMA crossovers, and triangular indicators to generate long and short alerts on the daily timeframe for swing trading strategies.
Dee_EMA 5.0 is an advanced EMA indicator that displays multiple exponential moving average values across different time frames in a single, easy-to-read table.
A festive TradingView indicator that adds playful snowflake labels to the chart, designed to bring holiday cheer while exploring chart visualization capabilities.
A planetary-based market sentiment indicator that tracks astrological aspects and declinations to provide insights into potential shifts in mass psychology and market movements.
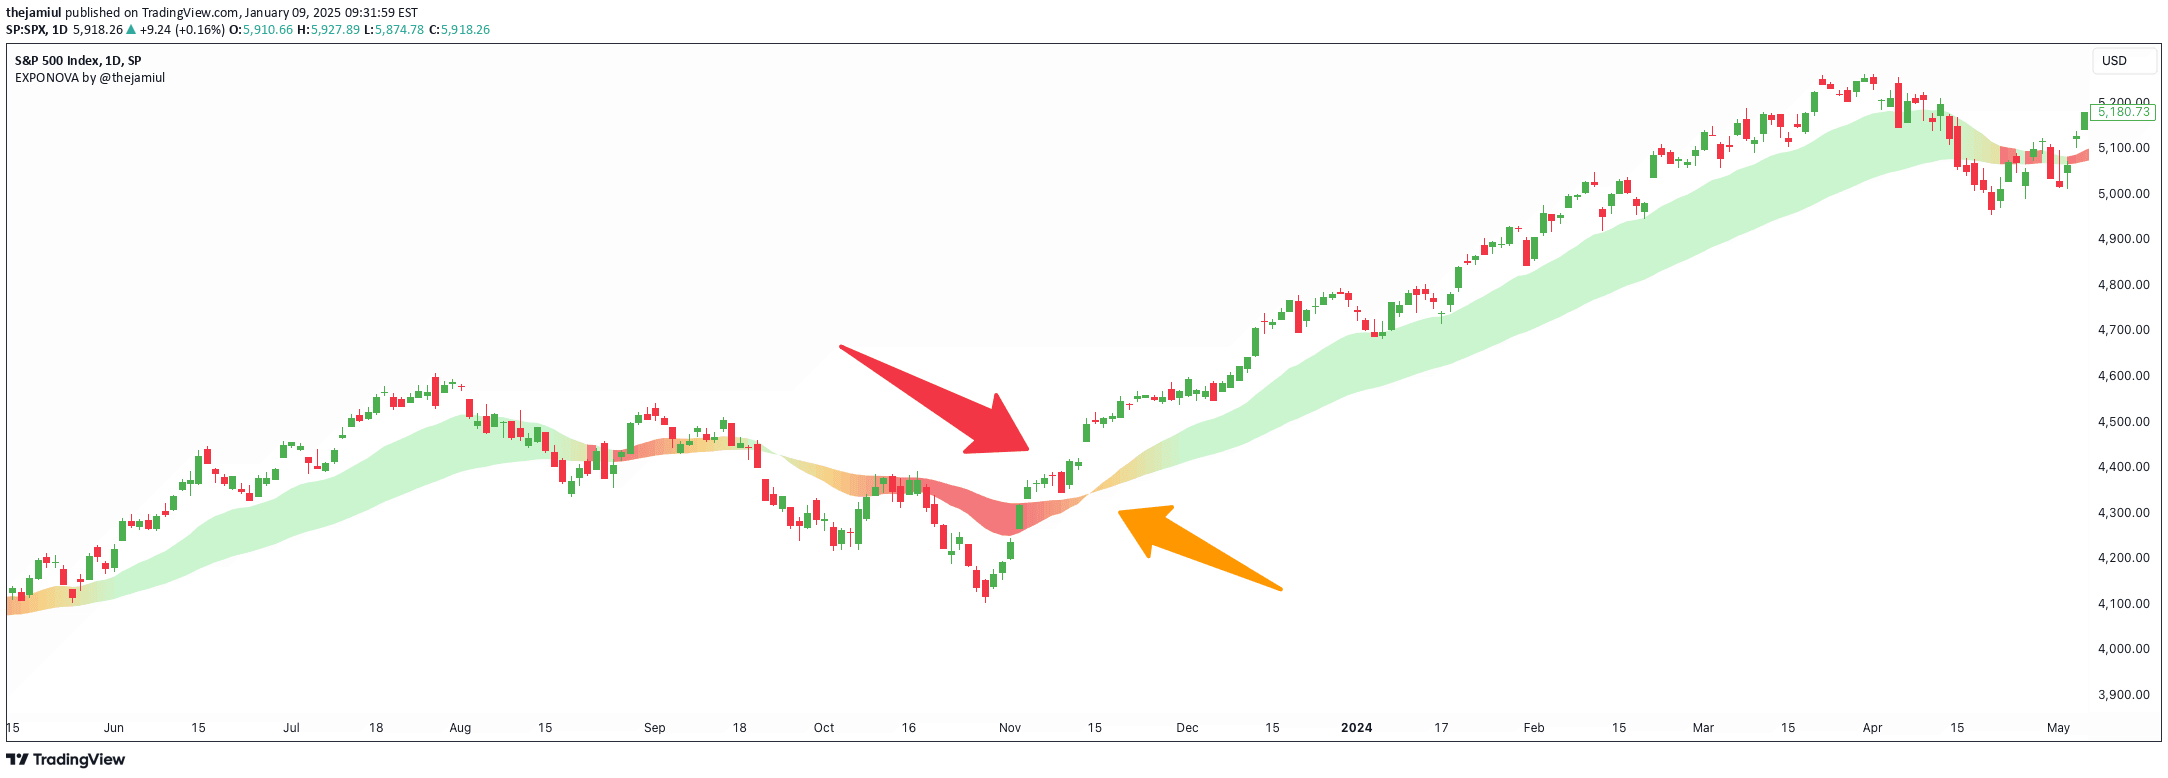
EXPONOVA is an advanced EMA-based indicator that uses dynamic gradient fills between two moving averages to visually represent market trends, momentum, and potential reversals.
A trading indicator using multiple Exponential Moving Averages to generate buy and sell signals by analyzing short-term and long-term market trends through strategic EMA crossovers.
The Retail Pain Index is a behavioral volatility tool that measures market stress by tracking how far price moves from the average entry zone, revealing potential trading opportunities.
A weighted fair price calculation that estimates the true center of market activity by balancing open, close, and trading volume within a specific interval.
Likes, views, and comments are historical TradingView snapshots. They describe attention, not trading performance.