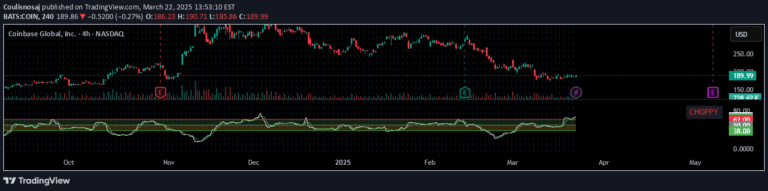
An advanced indicator that uses choppiness index and ATR standard deviation to dynamically detect market trends and ranges, providing color-coded bar signals for traders.
Explore complementary indicator rolesHow it works
This indicator starts by calculating the choppiness index, which measures market range characteristics. It then applies a sophisticated filter using the standard deviation of the Average True Range (ATR). By computing the running standard deviation of ATR and comparing it to recent low values, the indicator creates a dynamic filtering mechanism.
This filter helps make the choppiness index more responsive to emerging trends while maintaining sensitivity to potential range conditions. The result is a nuanced assessment of market state that goes beyond traditional choppiness measurements
Why it may be useful
Traders need reliable methods to distinguish between trending and ranging markets, as different strategies work best in each condition. This indicator provides a visual, color-coded approach to market state identification.
By dynamically adjusting its sensitivity through ATR standard deviation, it offers more responsive and adaptive insights than traditional choppiness indicators. The color-coded bars immediately communicate market conditions, allowing traders to quickly adjust their trading approach. This can help prevent costly mistakes by signaling potential shifts in market momentum
When to explore it
This indicator works best in markets with clear but potentially shifting trends, such as forex, equities, and commodities. It is particularly useful during periods of market transition where trend strength is uncertain. Traders should apply it in timeframes that capture intermediate price movements, typically daily or 4-hour charts.
It is most effective when combined with other trend confirmation tools like moving averages or momentum indicators. Avoid using it in extremely low-liquidity or highly volatile markets where price movements might not reflect true trend characteristics
Keep exploring
What we’ve verified
Access, alerts and repainting behaviour have not been independently verified for this indicator. Check the creator’s current publication and settings.
General descriptions and classifications are recovered research. Verified details above identify the specific checks we have completed. Check the creator’s current publication for later changes.