MA Sabres [LuxAlgo]
MA Sabres is a trend reversal indicator that uses moving averages to detect potential market direction changes and visualize them with sabre-shaped graphical elements.
Explore 11,183 indicators. Filter beyond the obvious.
Discover the tools that fit the way you trade.
11,183 tools to explore
MA Sabres is a trend reversal indicator that uses moving averages to detect potential market direction changes and visualize them with sabre-shaped graphical elements.
A dynamic technical analysis tool that visualizes market trends using adaptive radius-based bands that adjust to price action and volatility, providing insights into trend direction and strength.
A dynamic trendline indicator that detects and highlights support/resistance lines in real-time, with customizable filters for angle, length, and break detection across different market conditions.
The Gann Box is a technical analysis tool that uses geometric principles to identify potential support and resistance levels, forecast price movements, and analyze market trends.
A dynamic trendline drawing method that adapts to market volatility by using pivot points and Average True Range (ATR) to determine line angle and sensitivity.
A trend-following indicator using multiple moving averages to analyze market direction and strength across different periods. Provides visual 3D representation of trend dynamics using configurable moving average types.
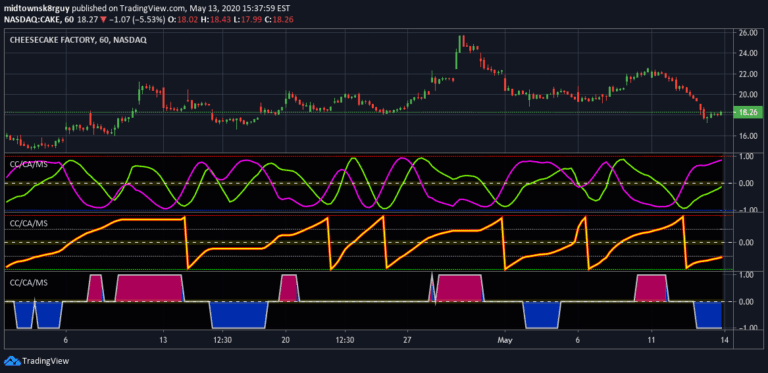
A multi-component trading indicator developed by Dr. John Ehlers that combines correlation cycle, correlation angle, and market state analysis to provide comprehensive market trend insights.
A trading signal using moving average gaps and average true range to identify breakout moves and potential entry/exit points with multiple filtering mechanisms.
A trading strategy using Fibonacci extension tool to identify triangle formations and predict potential take profit levels based on specific trend-based price movements.
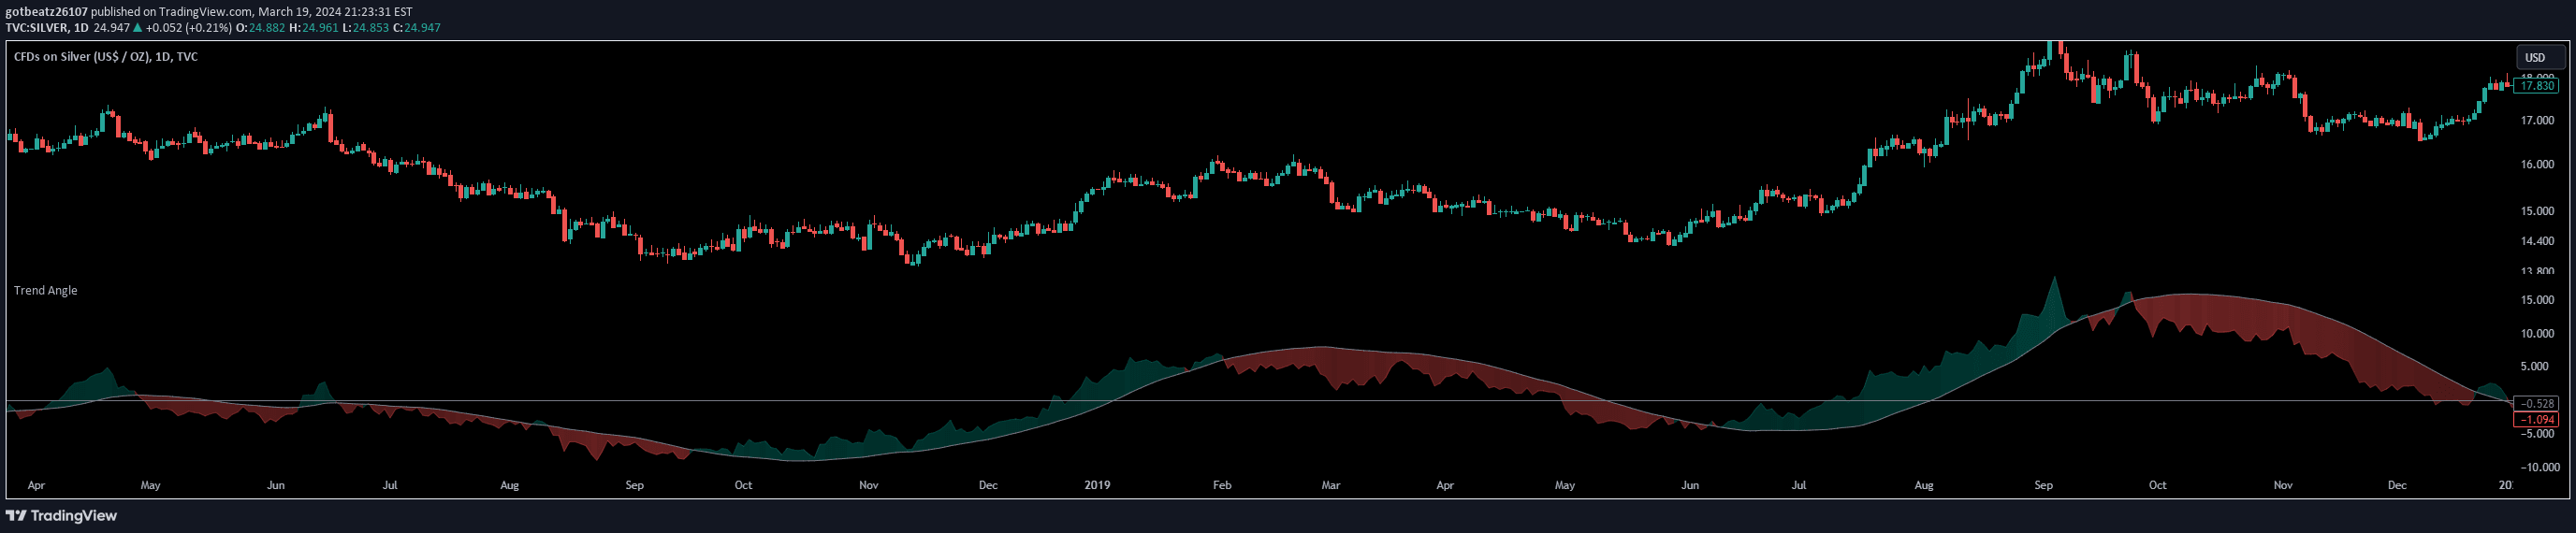
Trend Angle calculates the inclination of price movements over a specified timeframe, providing traders with a quantitative method to assess market directionality and momentum.
A volume profile tool that measures trading volume along angled trend lines, helping traders identify demand and supply zones in trending markets with interactive customization.
Trendlines are visual tools that connect price points to reveal market direction, helping traders identify potential support, resistance, and price movement trends.
Likes, views, and comments are historical TradingView snapshots. They describe attention, not trading performance.