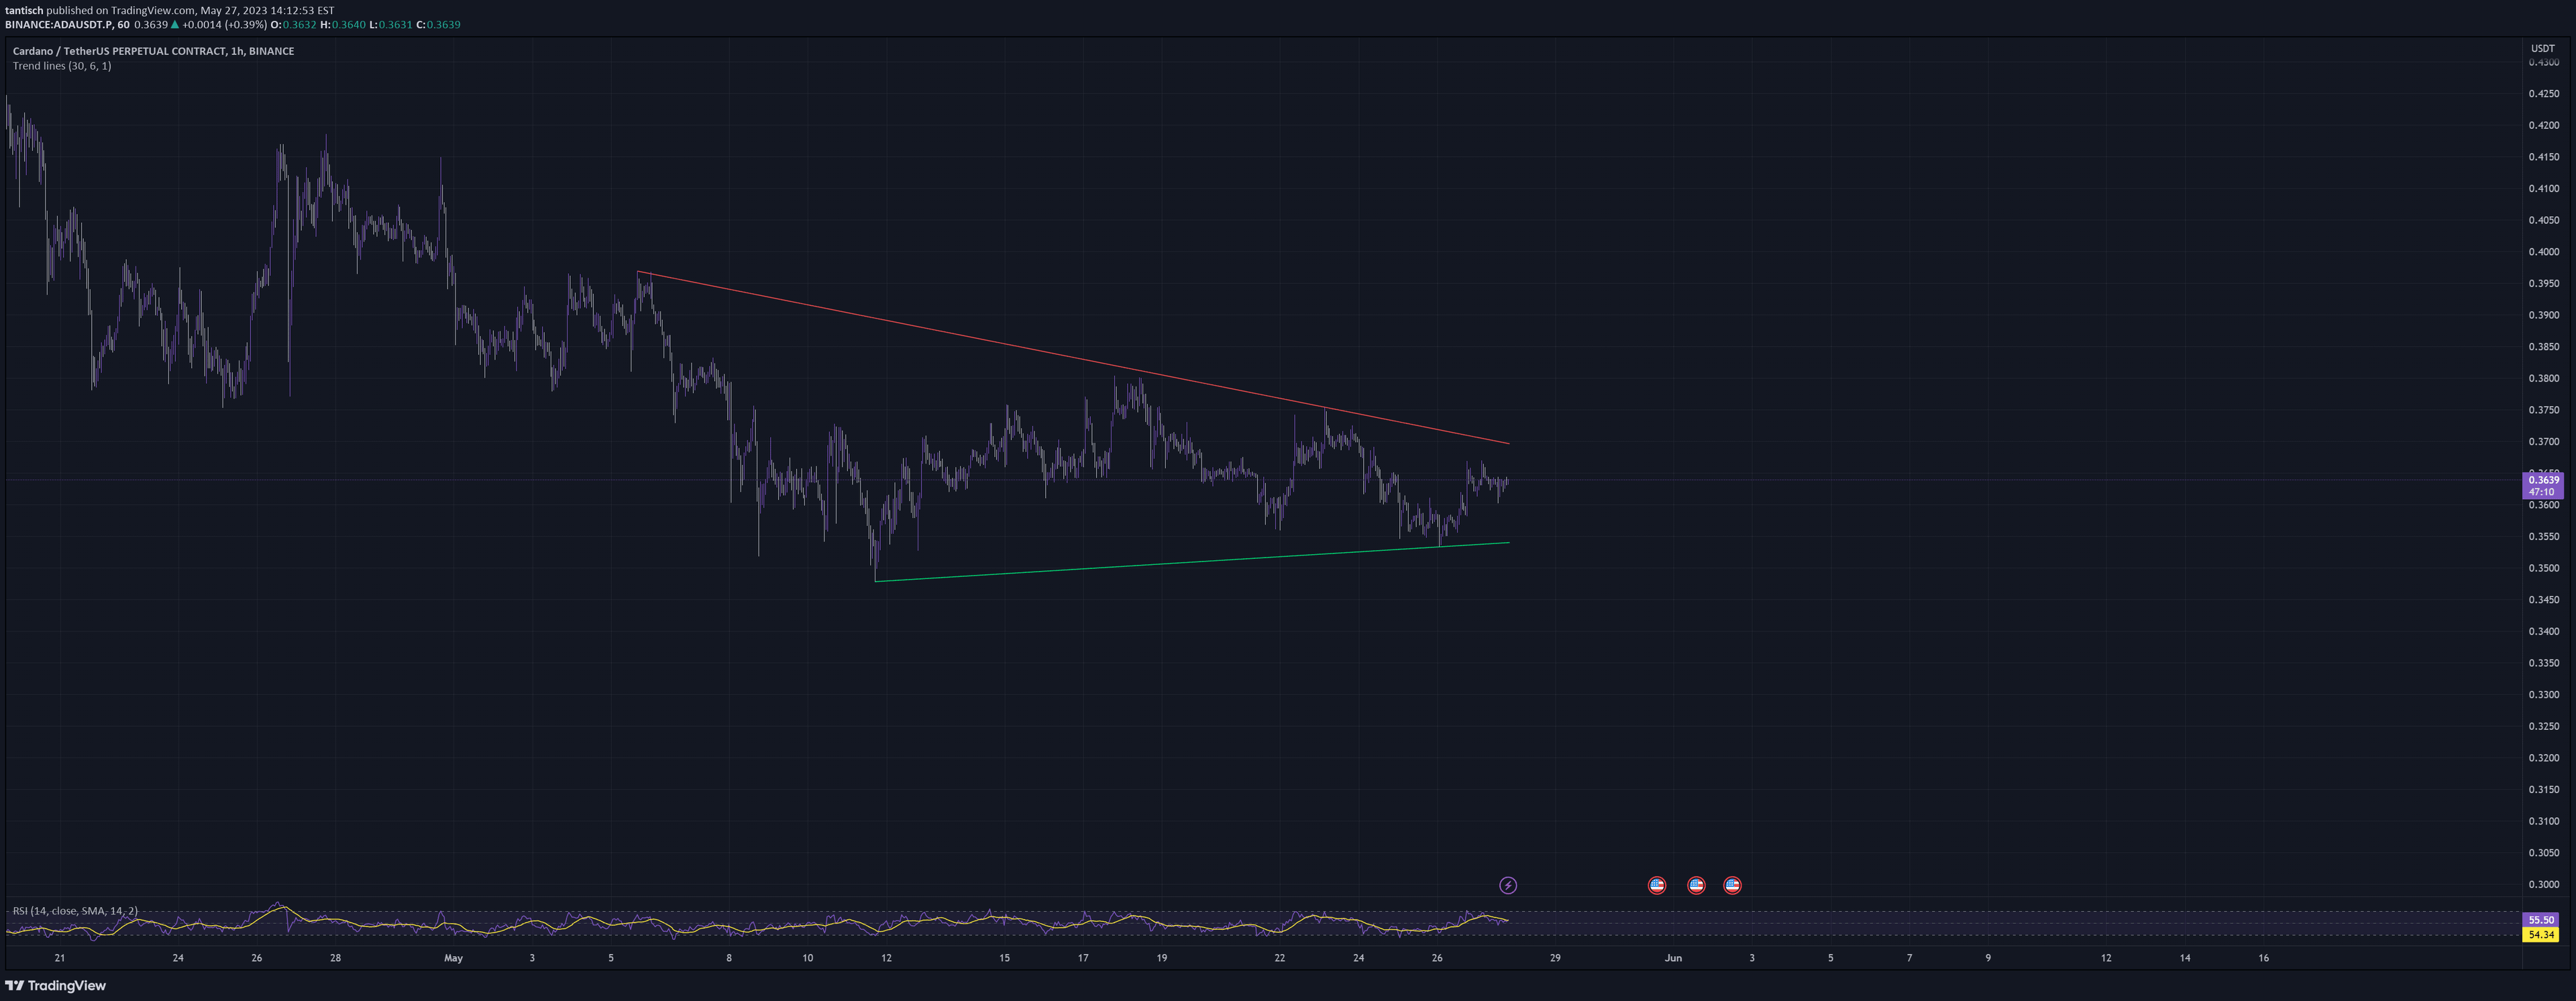
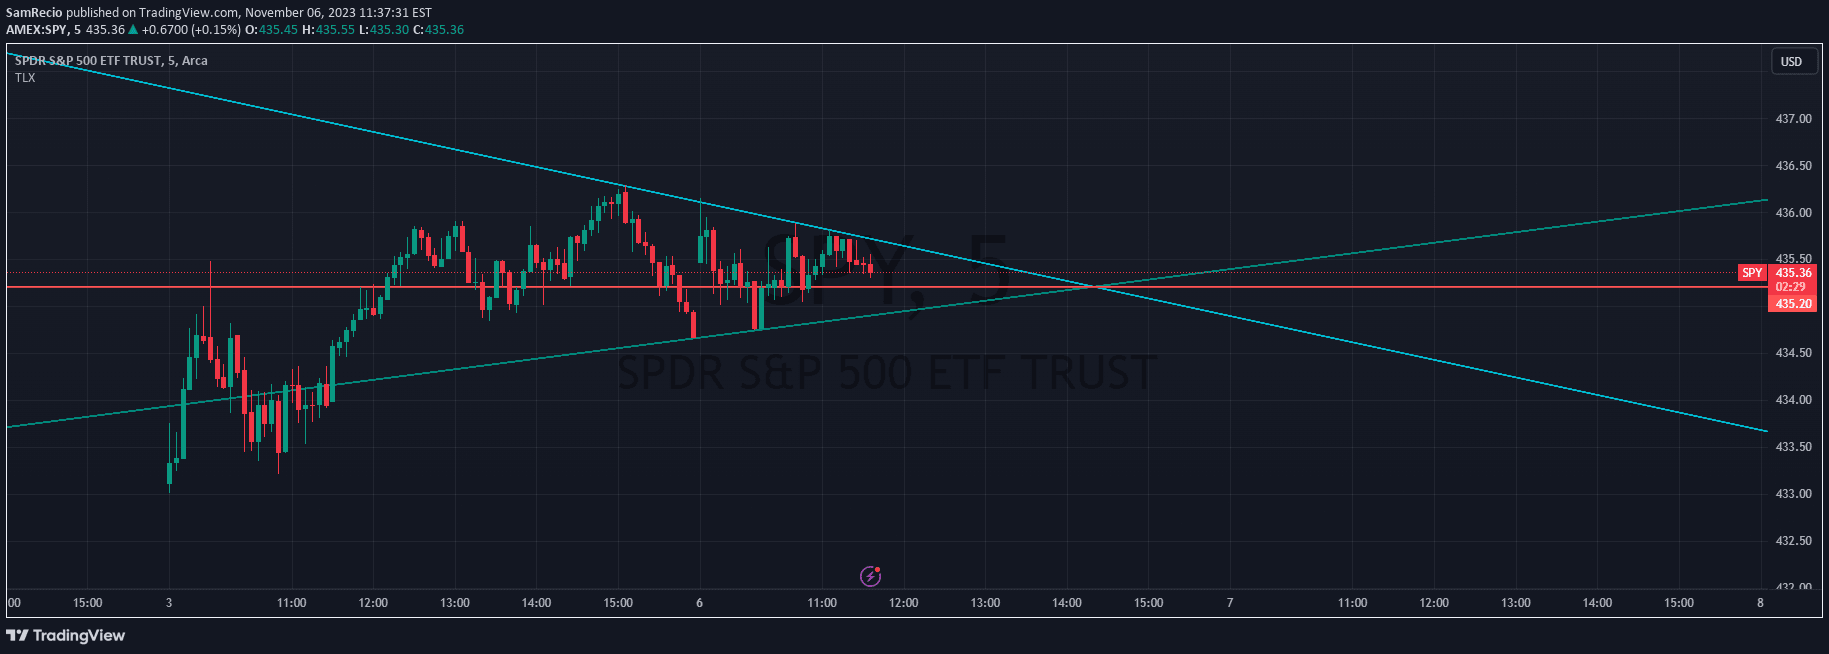
Trendlines are visual tools that connect price points to reveal market direction, helping traders identify potential support, resistance, and price movement trends.
Explore complementary indicator rolesHow it works
Trendlines are created by connecting two or more significant price points on a chart, typically using pivot highs or pivot lows. Traders draw these lines to visualize the market's directional movement and identify potential trend continuations or reversals.
The slope and angle of the trendline provide insights into the strength and momentum of the current price trend. A steeper trendline indicates a more aggressive trend, while a flatter line suggests a more gradual price movement.
Why it may be useful
Trendlines are crucial for technical analysts as they provide a quick and intuitive way to understand market dynamics without relying solely on fundamental analysis. They help traders quickly assess market sentiment and potential future price movements by visualizing the underlying trend.
By offering a clear visual representation of price direction, trendlines enable traders to make more informed decisions about entry and exit points, potential trend reversals, and overall market momentum.
When to explore it
Trendlines are most effective in markets with clear directional movements, such as trending markets with consistent price action. They work best when applied to liquid markets with sufficient price data points to create meaningful trend analysis.
Traders should use trendlines in conjunction with other technical indicators to confirm signals and reduce the risk of false trend interpretations. They are particularly useful in identifying potential support and resistance levels, as well as in developing trading strategies across various timeframes.
Keep exploring
What we’ve verified
Access, alerts and repainting behaviour have not been independently verified for this indicator. Check the creator’s current publication and settings.
General descriptions and classifications are recovered research. Verified details above identify the specific checks we have completed. Check the creator’s current publication for later changes.