Candle Strength Oscillator by SyntaxGeek
A candle strength oscillator measuring the difference between candle body and total range, using smoothed HMA to analyze price movement dynamics and potential market exhaustion.
Explore 11,183 indicators. Filter beyond the obvious.
Discover the tools that fit the way you trade.
11,183 tools to explore
A candle strength oscillator measuring the difference between candle body and total range, using smoothed HMA to analyze price movement dynamics and potential market exhaustion.
A custom Fibonacci retracement tool offering enhanced flexibility with personalized label options for tracking potential price reversal and continuation levels in trading analysis.
A price projection method using Feigenbaum mathematical theory to predict potential future price movements by identifying specific market structure and perturbation points.
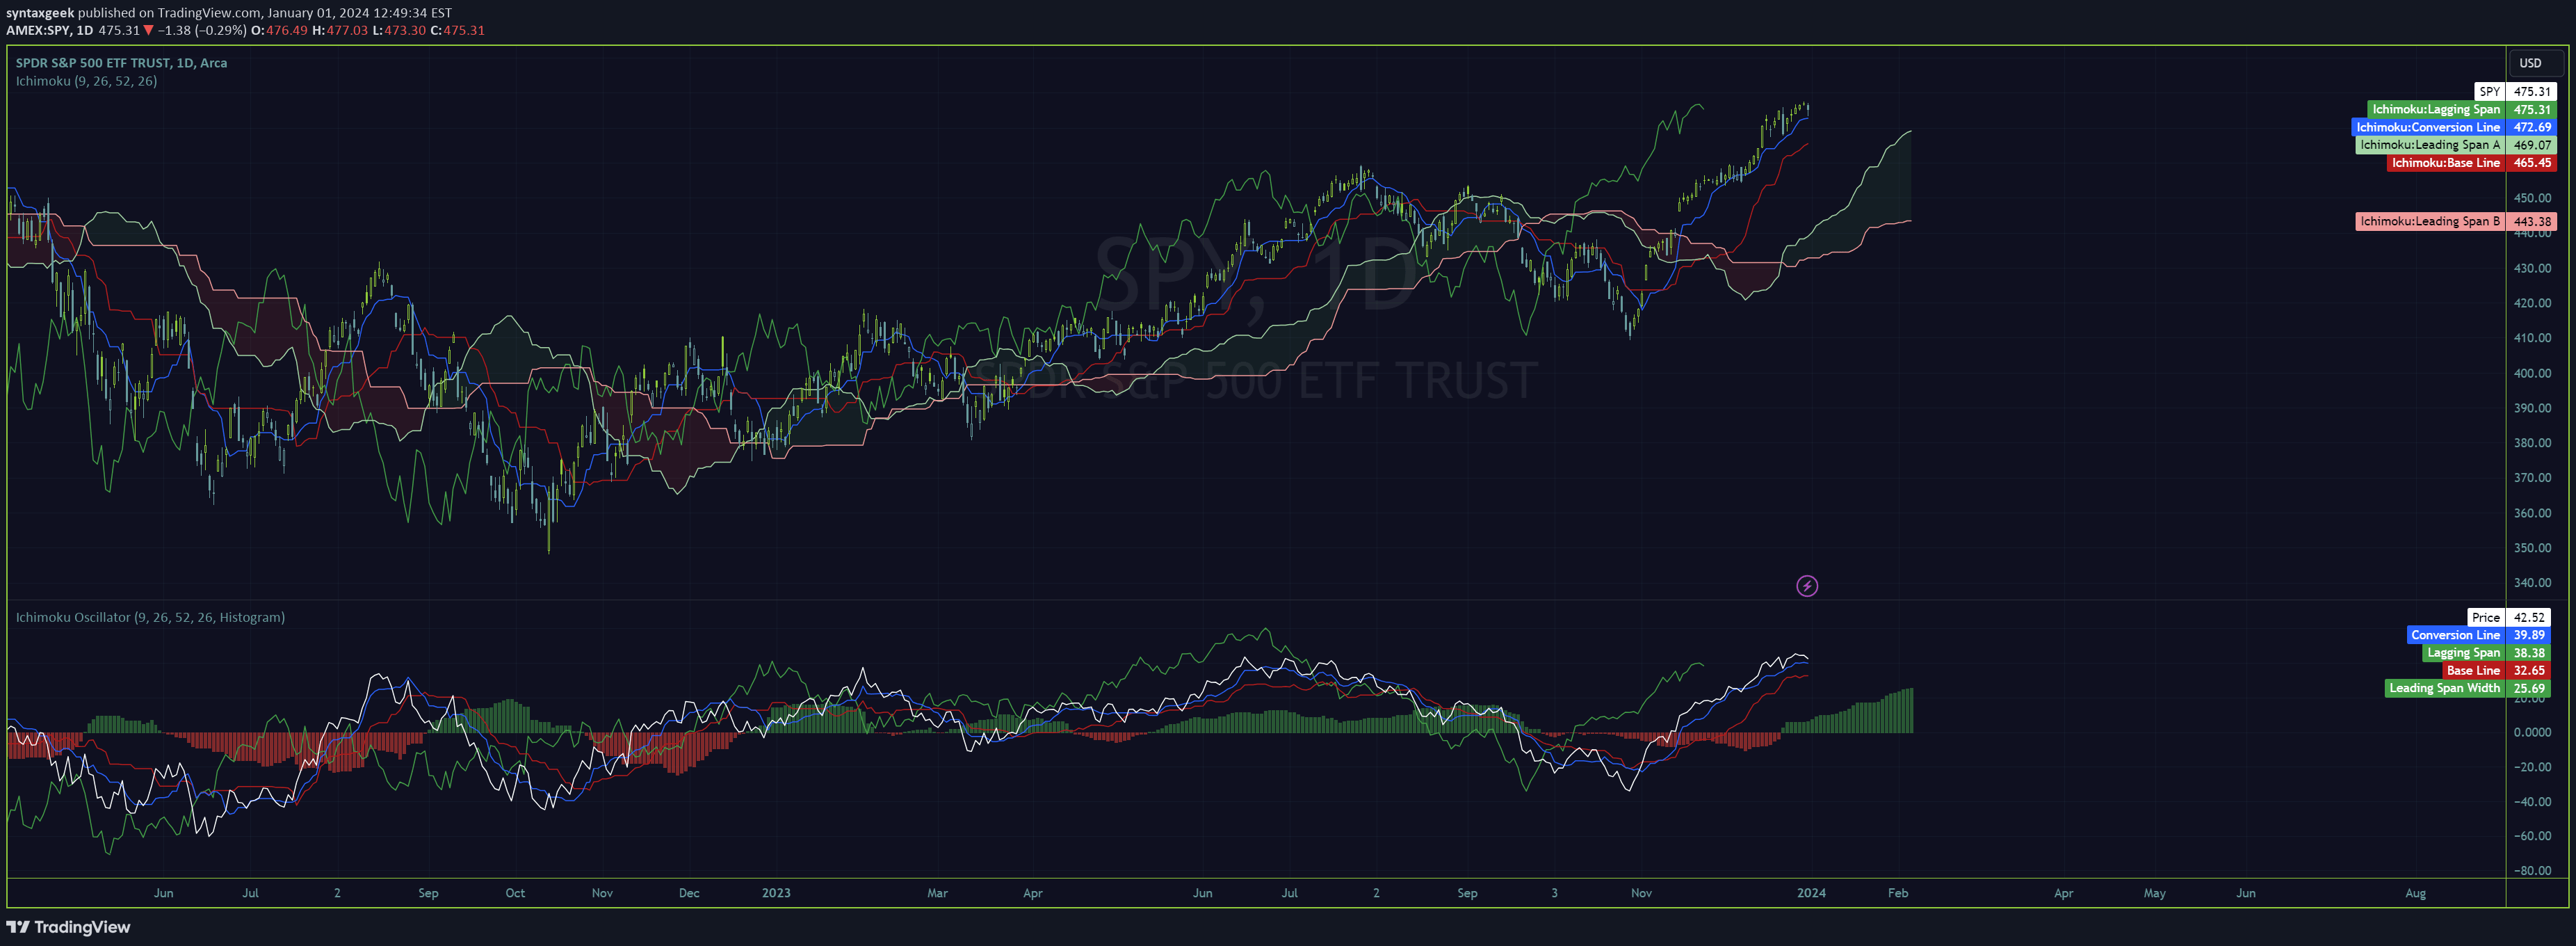
A modified Ichimoku cloud indicator that converts the cloud into an oscillation histogram, providing a cleaner chart display while maintaining key signal components and price relationship insights.
A trading indicator that measures price ranges by establishing an anchored point of origin and analyzing mid-range retracements to identify potential trading opportunities across different timeframes.
A pivot indicator that calculates price extensions based on open prices across different timeframes, providing dynamic support and resistance levels with optional VWAP integration.
A trading tool that enables visual trade plotting on charts, providing real-time profit and loss tracking with interactive entry and exit point selection.
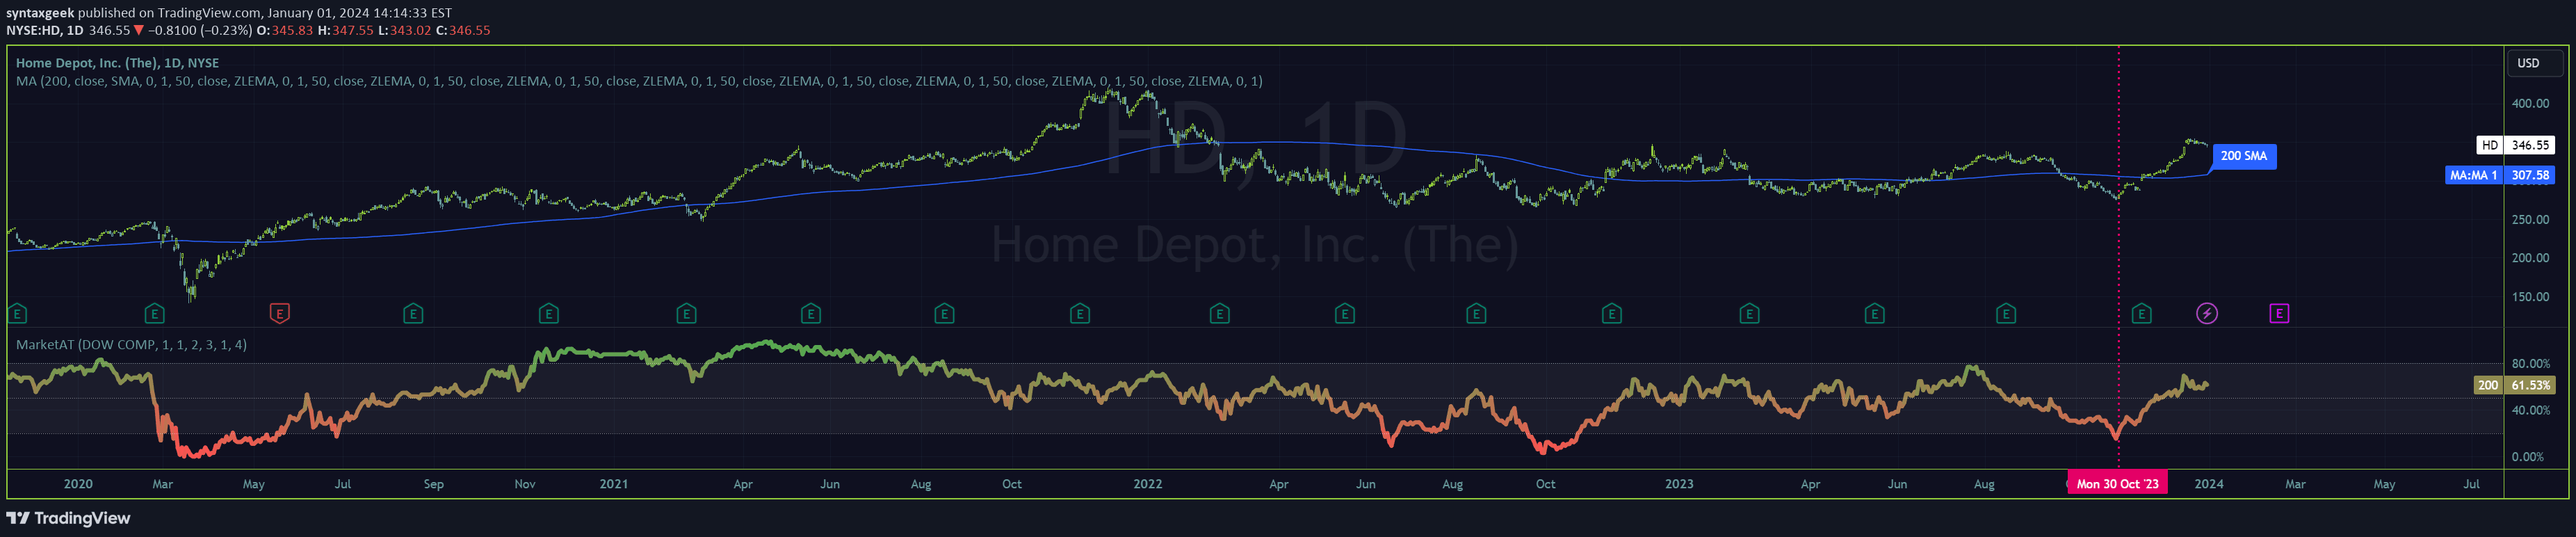
A comprehensive market breadth indicator that tracks stock index strength across multiple moving average timeframes, helping traders assess market sentiment and potential entry points.
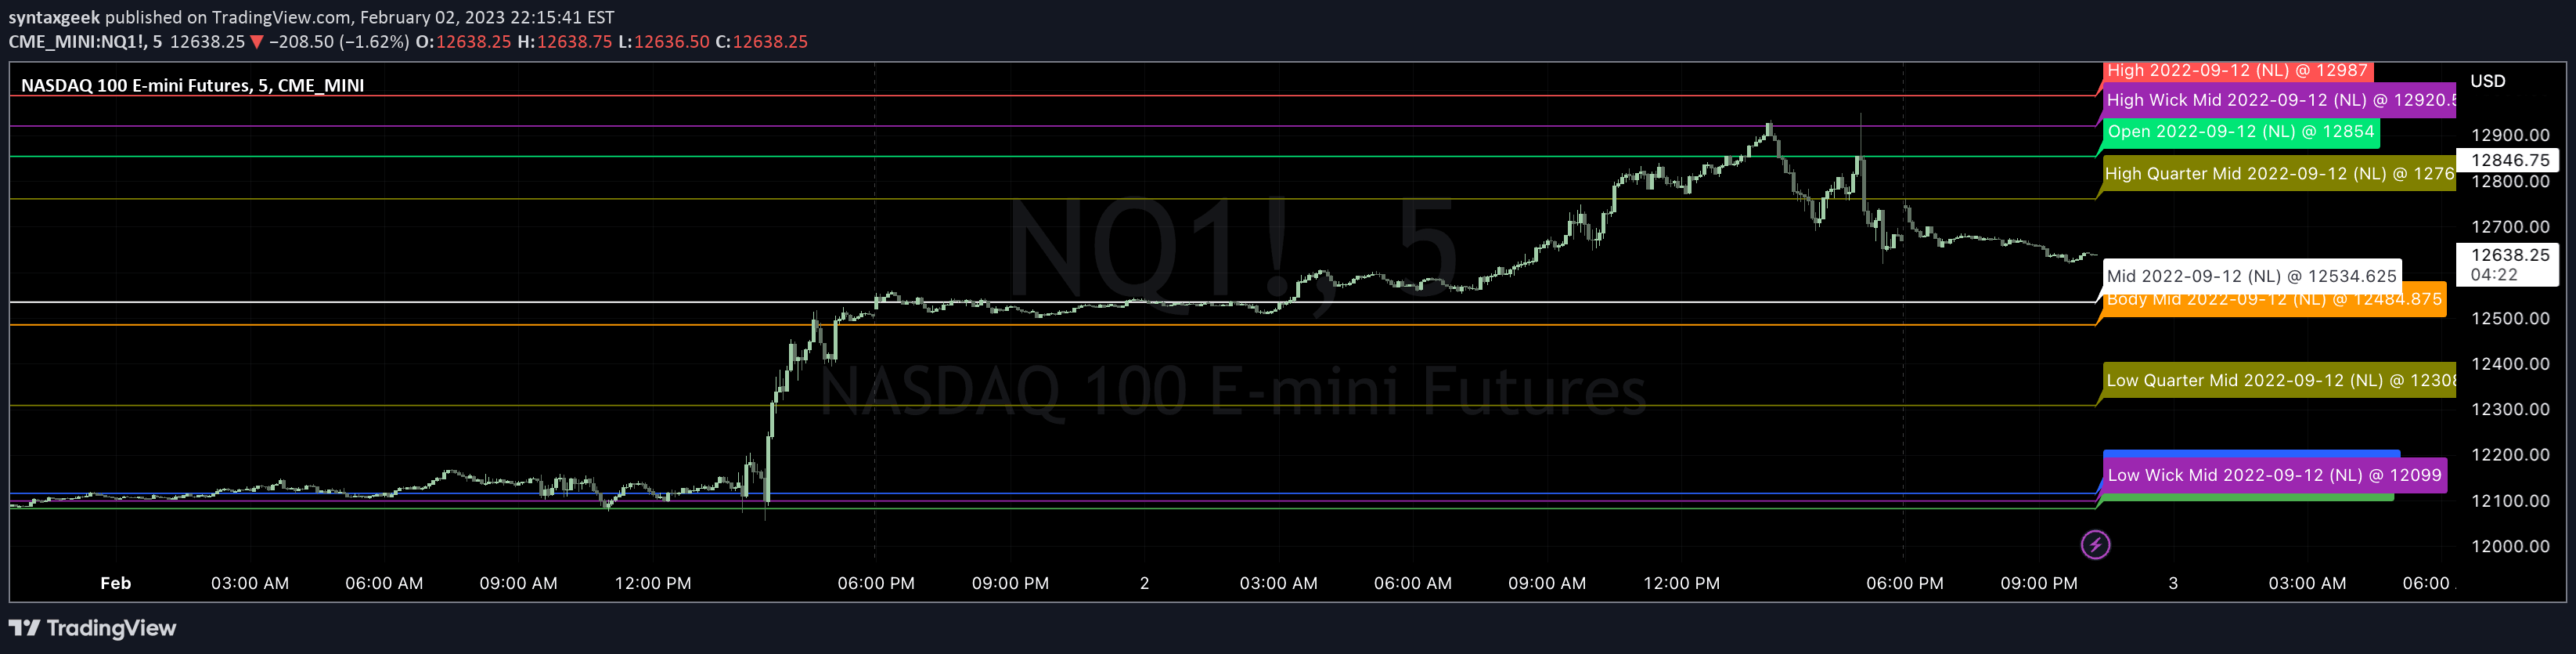
An automated tool for plotting precise candle-based chart levels, allowing interactive selection of timeframes and customizable label options for trading analysis.
A market breadth indicator that detects price pivots and provides insights into market strength or weakness using NYSE and NASDAQ breadth data during regular trading hours.
A price source delta indicator that tracks cumulative price changes using different calculation methods. Offers flexible analysis of price movement across various timeframes and symbols.
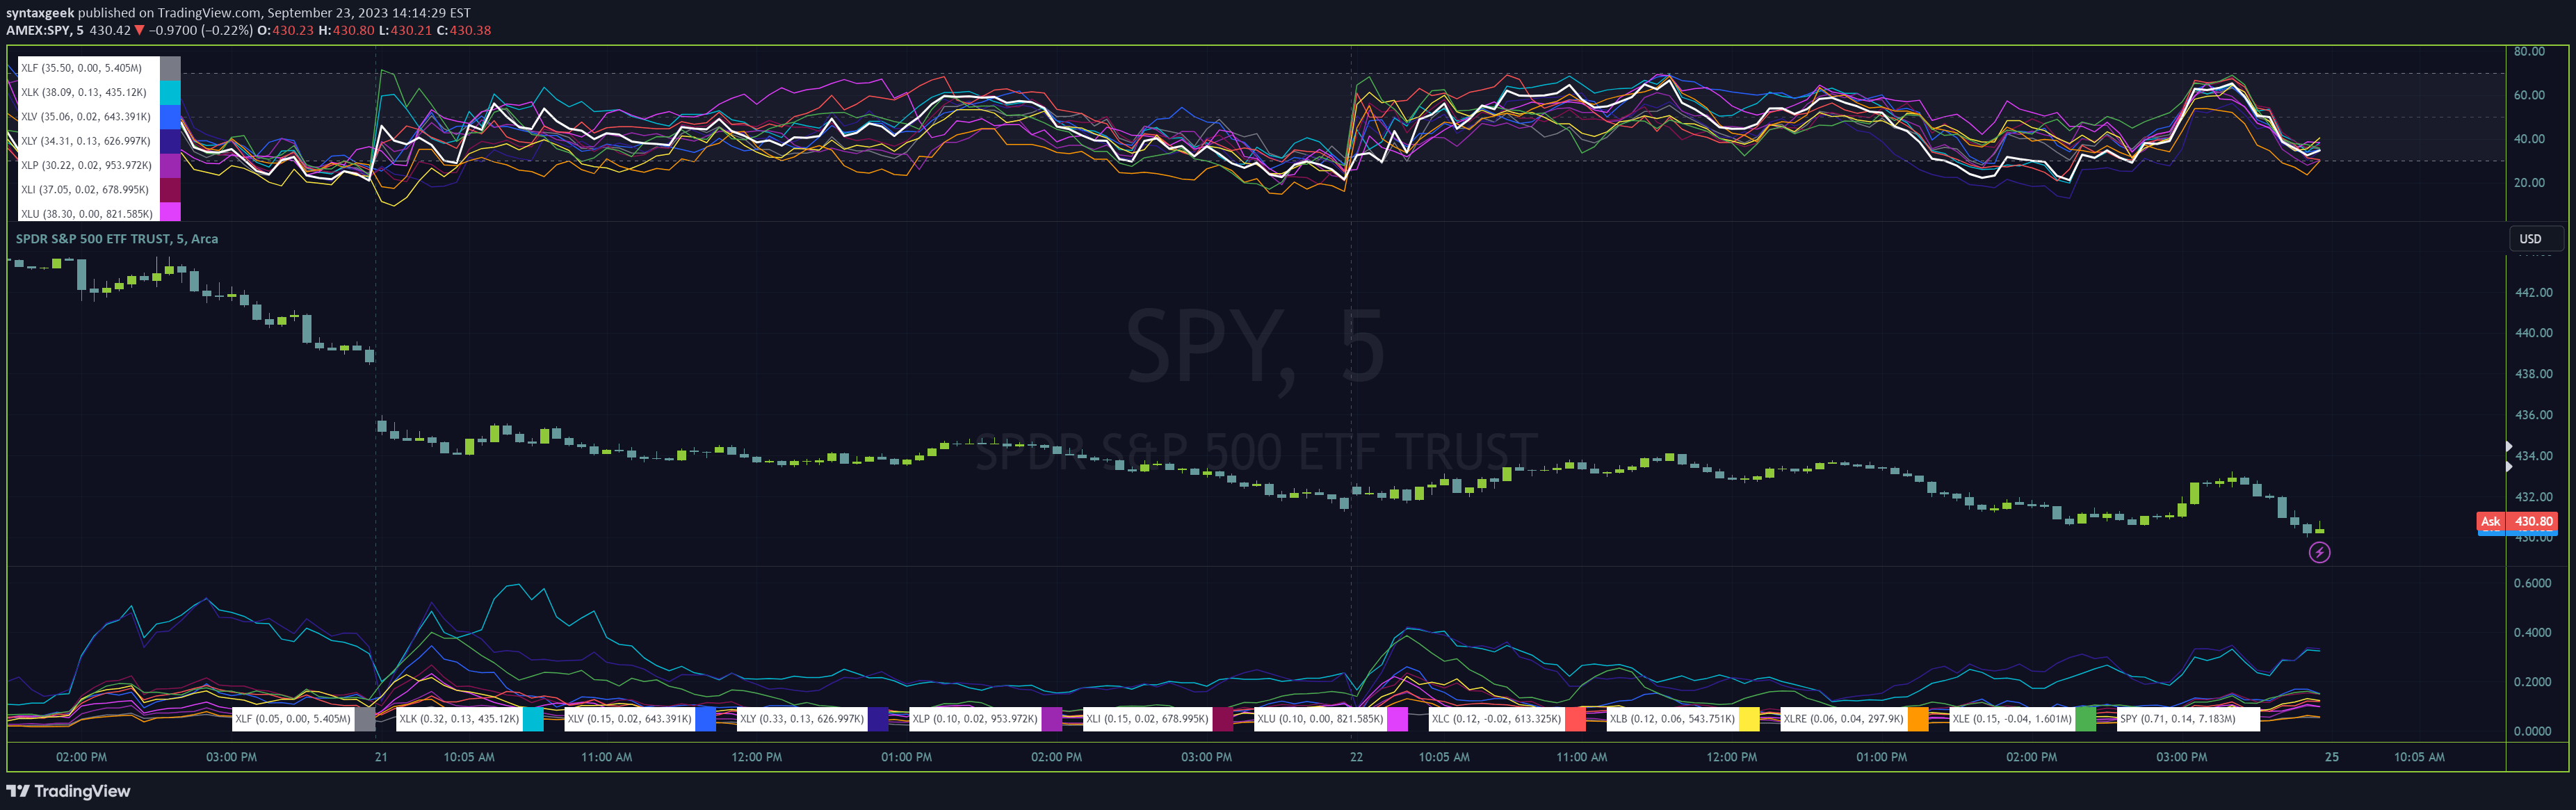
A comprehensive indicator tracking SPDR Index Funds to monitor sector performance, helping traders identify trend directions and potential investment opportunities across different market segments.
Likes, views, and comments are historical TradingView snapshots. They describe attention, not trading performance.