
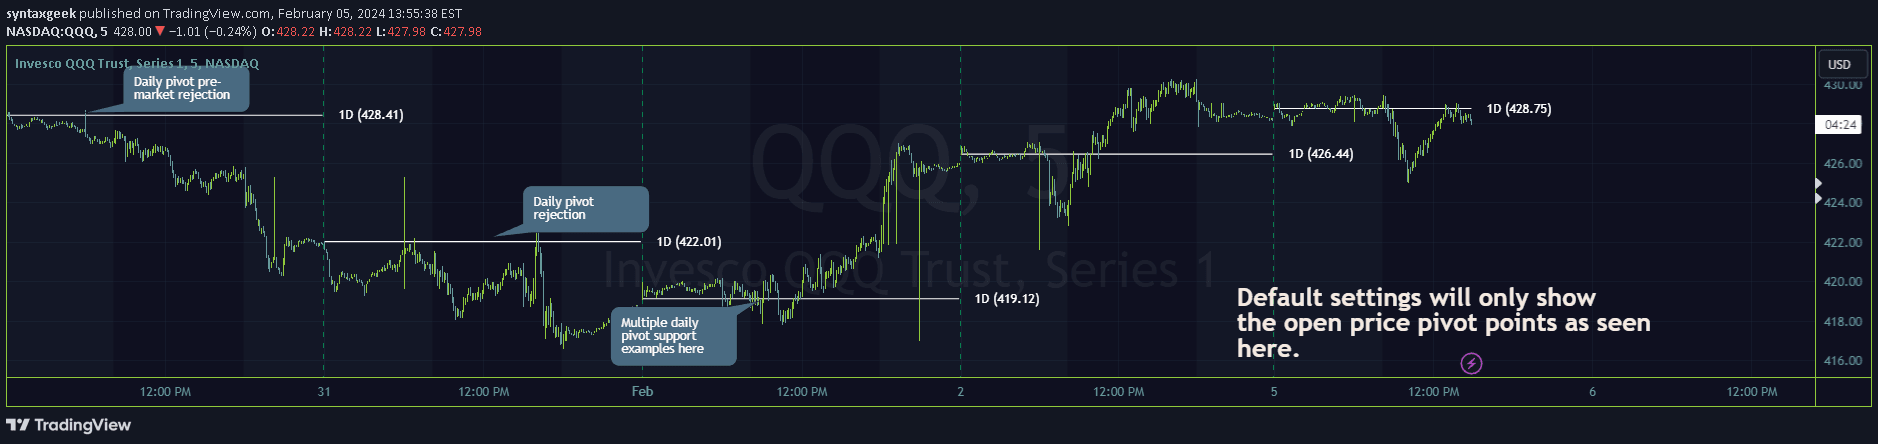
A pivot indicator that calculates price extensions based on open prices across different timeframes, providing dynamic support and resistance levels with optional VWAP integration.
Explore complementary indicator rolesHow it works
The Timeframe Pivots indicator analyzes open prices across different timeframes to generate pivot levels and potential price extensions. It calculates the difference between current and previous timeframe open prices, then divides this difference in half to create extension levels above and below the pivot point.
When markets exhibit tight range conditions, the indicator intelligently adapts by using historical range data instead of current minimal price movements. This ensures meaningful projection levels by referencing the last 14 range widths and selecting an appropriate half-range width for calculating extensions.
Why it may be useful
Traders benefit from this indicator's unique approach to identifying potential price movement zones with high precision and adaptability. By anchoring pivot levels directly to open prices, it provides a more dynamic and responsive method of market analysis compared to traditional static pivot point indicators.
The optional VWAP integration adds additional depth by incorporating volume-weighted average price, enabling traders to understand trend dynamics and volume relationships within the identified pivot ranges. This multi-dimensional approach helps traders make more informed decisions about potential market movements and entry/exit points.
When to explore it
The Timeframe Pivots indicator is most effective in markets with clear directional movements and distinct open price relationships across multiple timeframes. It performs exceptionally well when analyzing daily, weekly, and monthly charts to establish broader market sentiment and potential trading ranges.
Traders should utilize this tool when seeking to identify key support and resistance levels, especially during trend transitions or when evaluating potential breakout scenarios. It is particularly useful for traders who want a flexible, adaptive pivot indicator that can dynamically adjust to changing market conditions.
Keep exploring
What we’ve verified
Access, alerts and repainting behaviour have not been independently verified for this indicator. Check the creator’s current publication and settings.
General descriptions and classifications are recovered research. Verified details above identify the specific checks we have completed. Check the creator’s current publication for later changes.


