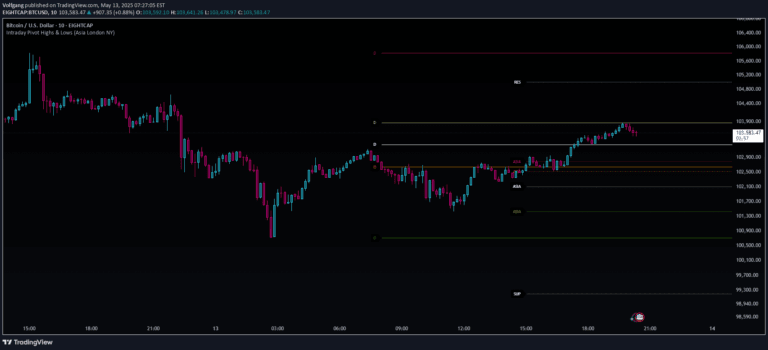
A market breadth indicator that detects price pivots and provides insights into market strength or weakness using NYSE and NASDAQ breadth data during regular trading hours.
Explore complementary indicator rolesHow it works
The indicator combines simple pivot detection with market breadth ratios to analyze price movements and market sentiment. It identifies potential pivot points in price action and correlates them with underlying market breadth metrics, allowing traders to understand the broader market dynamics.
By tracking NYSE and NASDAQ market breadth data, the indicator calculates ratios that reveal the strength or weakness of price movements. The system supports adjustable lookback periods and can display live breadth information directly on the current candle, with a maximum of 500 labels that can be redrawn when scrolling through historical chart data.
Why it may be useful
Market breadth indicators provide crucial insights into the overall market sentiment and potential trend reversals by analyzing the collective performance of multiple stocks. This approach helps traders understand whether price movements are supported by broad market participation or are potentially weak and unsustainable.
By integrating pivot detection with market breadth analysis, traders can gain a more comprehensive view of market conditions. The indicator allows for quick assessment of whether price movements are backed by widespread market momentum or are potentially isolated events, enabling more informed trading decisions.
When to explore it
This indicator is most effective during regular trading hours (RTH) when comprehensive market breadth data is available. It is particularly useful for traders seeking to understand the underlying market dynamics and validate potential price movements through broader market context.
The signal works best on timeframes up to 1-hour charts, providing traders with insights into short to medium-term market sentiment. Traders should be cautious about using the indicator during extended trading hours, as market breadth data may be limited or unavailable during those periods.
Keep exploring
What we’ve verified
Access, alerts and repainting behaviour have not been independently verified for this indicator. Check the creator’s current publication and settings.
General descriptions and classifications are recovered research. Verified details above identify the specific checks we have completed. Check the creator’s current publication for later changes.