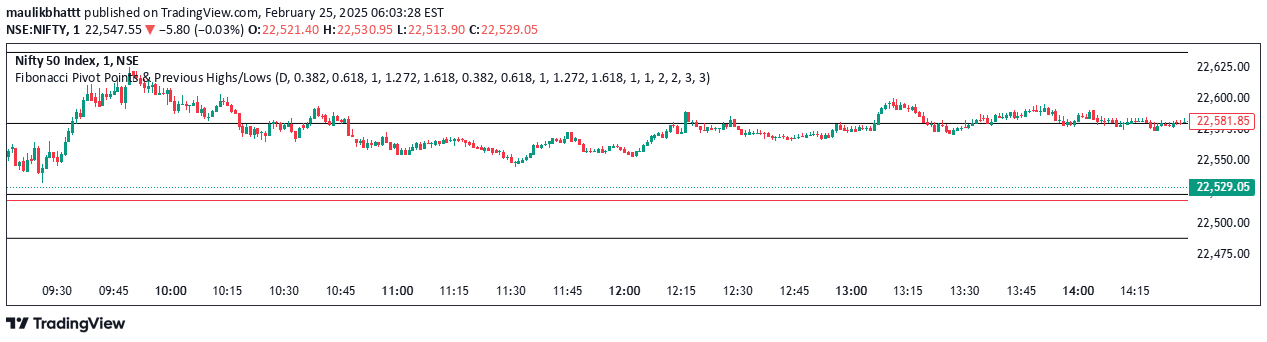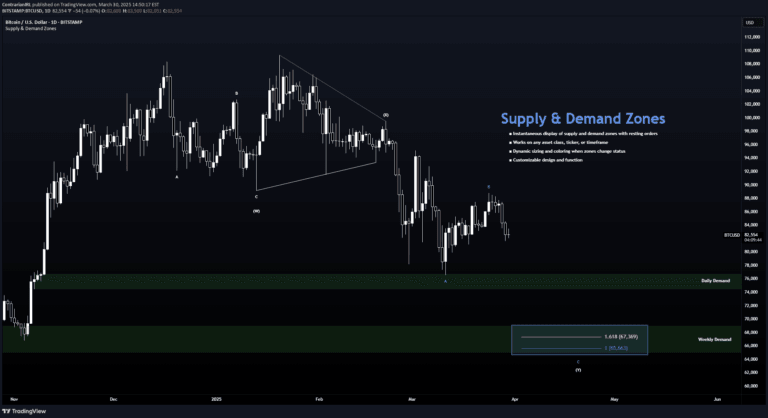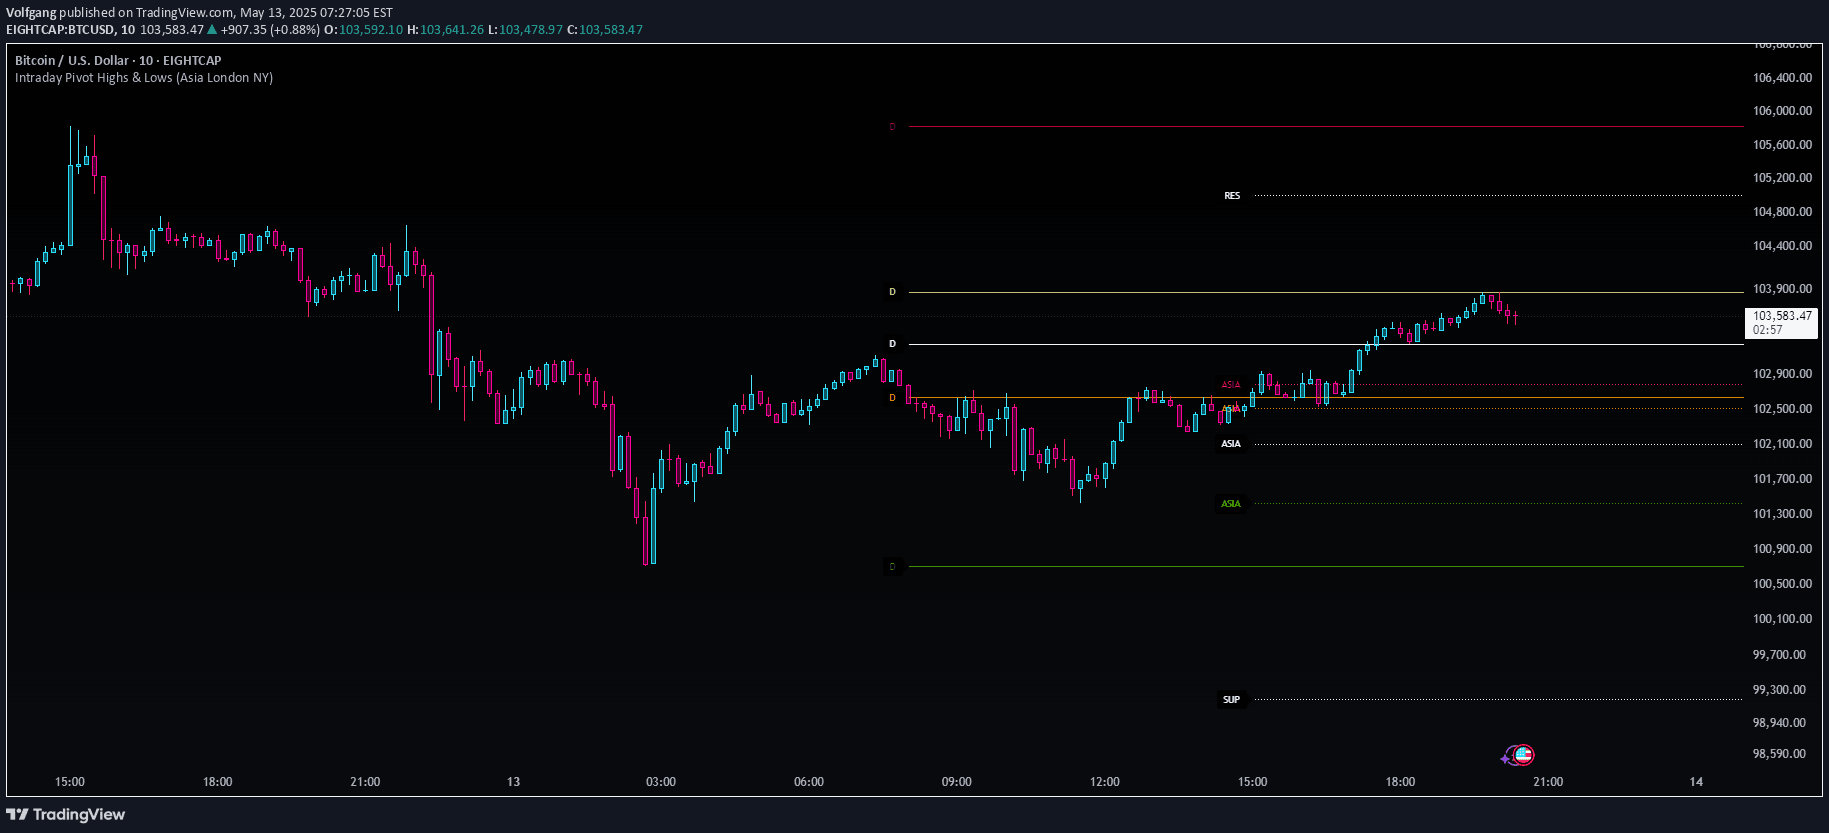
An advanced pivot point indicator that tracks intraday price levels across Asia, London, and New York trading sessions, providing dynamic support and resistance zones for forex traders.
Explore complementary indicator rolesHow it works
The indicator dynamically calculates and plots high, low, midpoint, and Fibonacci retracement levels for each major trading session: Asia, London, and New York. It uses distinct visual styles and colors to differentiate between sessions, with solid lines for New York, dashed for London, and dotted for Asia.
At the close of each session, the indicator automatically calculates and displays key price levels, including session highs, lows, midpoints, and 0.618 Fibonacci retracement levels. These levels are automatically cleared at the start of the next session, ensuring a clean and uncluttered chart for traders.
Why it may be useful
This indicator provides traders with critical insights into intraday price dynamics across major forex trading sessions, helping them identify potential support and resistance zones more effectively. By integrating pivot calculations and session-specific levels, traders can gain a more nuanced understanding of market structure and price action.
The unique visual presentation allows traders to quickly interpret complex price information, enhancing their ability to make informed trading decisions. The combination of session-based levels, Fibonacci retracements, and clear visual cues helps traders identify potential reversal zones and improve their overall trading strategy.
When to explore it
The indicator is most effective when trading liquid forex pairs with clear session-based price action, particularly during major market sessions like Asia, London, and New York. It is particularly useful for scalpers and day traders looking to identify key intraday price levels and potential trading opportunities.
Traders should focus on using this indicator on major currency pairs and ensure they have 24-hour price action data. It is especially valuable during session opens and kill zones, where price action tends to be more volatile and directional.
Keep exploring
What we’ve verified
Access, alerts and repainting behaviour have not been independently verified for this indicator. Check the creator’s current publication and settings.
General descriptions and classifications are recovered research. Verified details above identify the specific checks we have completed. Check the creator’s current publication for later changes.