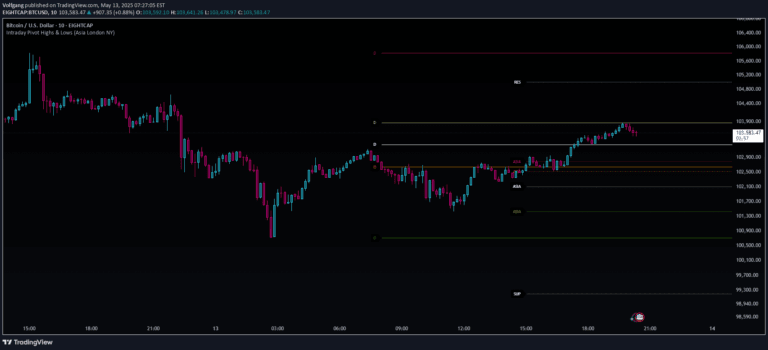
A technical analysis tool combining Fibonacci Pivot Points with historical high and low levels to identify key support and resistance zones across different timeframes.
Explore complementary indicator rolesHow it works
The indicator calculates pivot points by averaging the high, low, and close prices, then applies Fibonacci levels to determine support and resistance zones. It uses a specific formula to derive these levels, with pivot point (pp) calculated as the average of high, low, and close prices.
Additionally, the tool fetches previous high and low levels from different timeframes like daily, weekly, and monthly charts. These historical levels are plotted as lines across the chart, providing traders with visual reference points for potential price interactions and trend analysis.
Why it may be useful
Fibonacci Pivot Points offer traders a systematic approach to identifying potential market turning points and key price levels. By combining mathematical calculations with historical price data, the indicator provides a comprehensive view of potential support and resistance zones that can guide trading decisions.
The multi-timeframe approach allows traders to gain insights across different market perspectives, helping them understand potential price movements and make more informed trading strategies. This versatility makes the indicator valuable for traders seeking a structured method of technical analysis.
When to explore it
This indicator is most effective in markets with clear trending or range-bound characteristics, where support and resistance levels play a crucial role in price movement. Traders can utilize these levels during periods of market consolidation or when looking to identify potential entry and exit points.
The tool is particularly useful during volatile market conditions, where understanding key price levels can help manage risk and make more calculated trading decisions. It works best when combined with other technical analysis tools to confirm potential trade setups and validate market signals.
Keep exploring
What we’ve verified
Access, alerts and repainting behaviour have not been independently verified for this indicator. Check the creator’s current publication and settings.
General descriptions and classifications are recovered research. Verified details above identify the specific checks we have completed. Check the creator’s current publication for later changes.