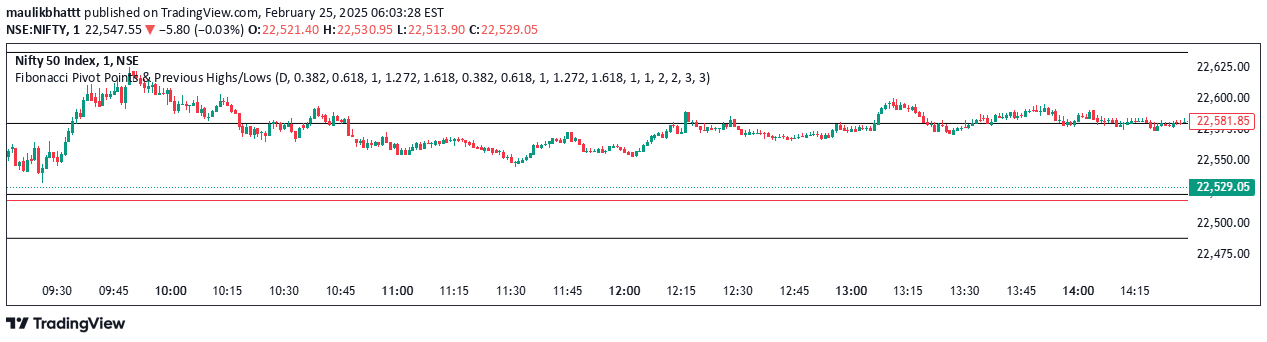
A TradingView script that automatically identifies and displays premarket high and low price levels for the current trading day, with customizable visual markers.
Explore complementary indicator rolesHow it works
The script operates by tracking price movements during the premarket session, specifically from 04:00 to 09:30 Eastern Time. It automatically identifies and records the highest and lowest price points during this timeframe, creating horizontal rays that extend across the chart to visualize these critical levels.
These price markers are dynamically generated and refreshed daily, ensuring that traders always have the most current premarket reference points. The script offers extensive customization options, allowing users to adjust line colors, widths, styles, and label configurations to suit their individual trading preferences and visual analysis needs.
Why it may be useful
Premarket price levels provide crucial insights into potential market sentiment and initial trading dynamics before the regular market session begins. By identifying the high and low points during this period, traders can gain early understanding of potential support and resistance levels, market volatility, and initial price momentum.
These markers help traders prepare strategic entry and exit points, assess potential trade opportunities, and develop more informed trading decisions. The customizable nature of the script allows traders to adapt the visualization to their specific trading style and visual preferences, enhancing their analytical capabilities.
When to explore it
This script is most effective for traders focusing on day trading and scalping strategies, particularly those interested in U.S. market hours and early morning price movements. It is especially valuable for traders who want to understand premarket price ranges and potential market sentiment before the regular trading session.
Traders can utilize these premarket high and low markers to identify potential breakout levels, assess initial market strength or weakness, and develop more precise trading strategies. The script is particularly useful for active traders who require real-time, dynamic market level information to make quick and informed trading decisions.
Keep exploring
What we’ve verified
Access, alerts and repainting behaviour have not been independently verified for this indicator. Check the creator’s current publication and settings.
General descriptions and classifications are recovered research. Verified details above identify the specific checks we have completed. Check the creator’s current publication for later changes.