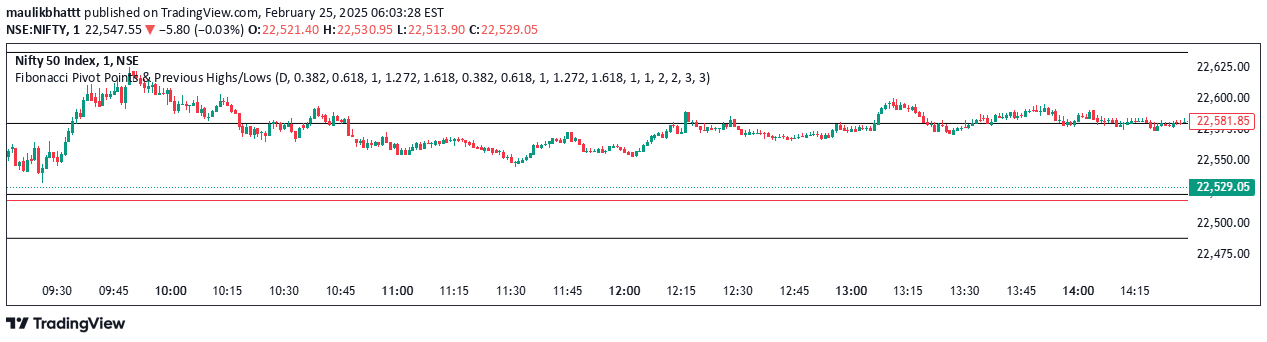
A combined trading signal that tracks opening range breakouts and daily/weekly pivot levels to identify potential trading opportunities based on price action around key market levels.
Explore complementary indicator rolesHow it works
The signal combines two key analytical methods: an Opening Range Breakout (ORB) indicator and a daily/weekly high/low pivot indicator. The ORB tracks the price movement within the first X minutes of the trading day, establishing high and low boundaries. If the price closes above or below these initial range boundaries, it triggers specific alerts indicating potential trend momentum.
The daily/weekly pivot component plots previous day and week's high and low levels, creating additional reference points for price action. By monitoring these critical levels, traders can quickly identify when current price movement breaks through established support or resistance zones, signaling potential trend continuation or reversal.
Why it may be useful
This signal provides traders with a comprehensive view of market dynamics by combining multiple analytical perspectives into a single, powerful trading tool. By tracking both intraday opening range and longer-term pivot levels, traders gain insights into potential price movements and trend strength across different timeframes.
The signal's alerts help traders make more informed decisions by highlighting key price action moments. These notifications can trigger entry or exit strategies, helping traders capitalize on potential breakout opportunities and manage risk more effectively by providing clear, objective markers of market sentiment.
When to explore it
The signal works best in markets with clear, defined price movements and during periods of moderate to high volatility. It is particularly effective for day traders and scalpers who need quick, actionable insights into potential price trends within short timeframes. Traders should use this signal when seeking to identify potential breakout moments and validate trend momentum.
Optimal application occurs in liquid markets with consistent trading volumes, such as major stock indices, forex pairs, and actively traded commodities. Traders should combine this signal with other technical and fundamental analysis tools to increase the probability of successful trades and minimize false signal risks.
Keep exploring
What we’ve verified
Access, alerts and repainting behaviour have not been independently verified for this indicator. Check the creator’s current publication and settings.
General descriptions and classifications are recovered research. Verified details above identify the specific checks we have completed. Check the creator’s current publication for later changes.