
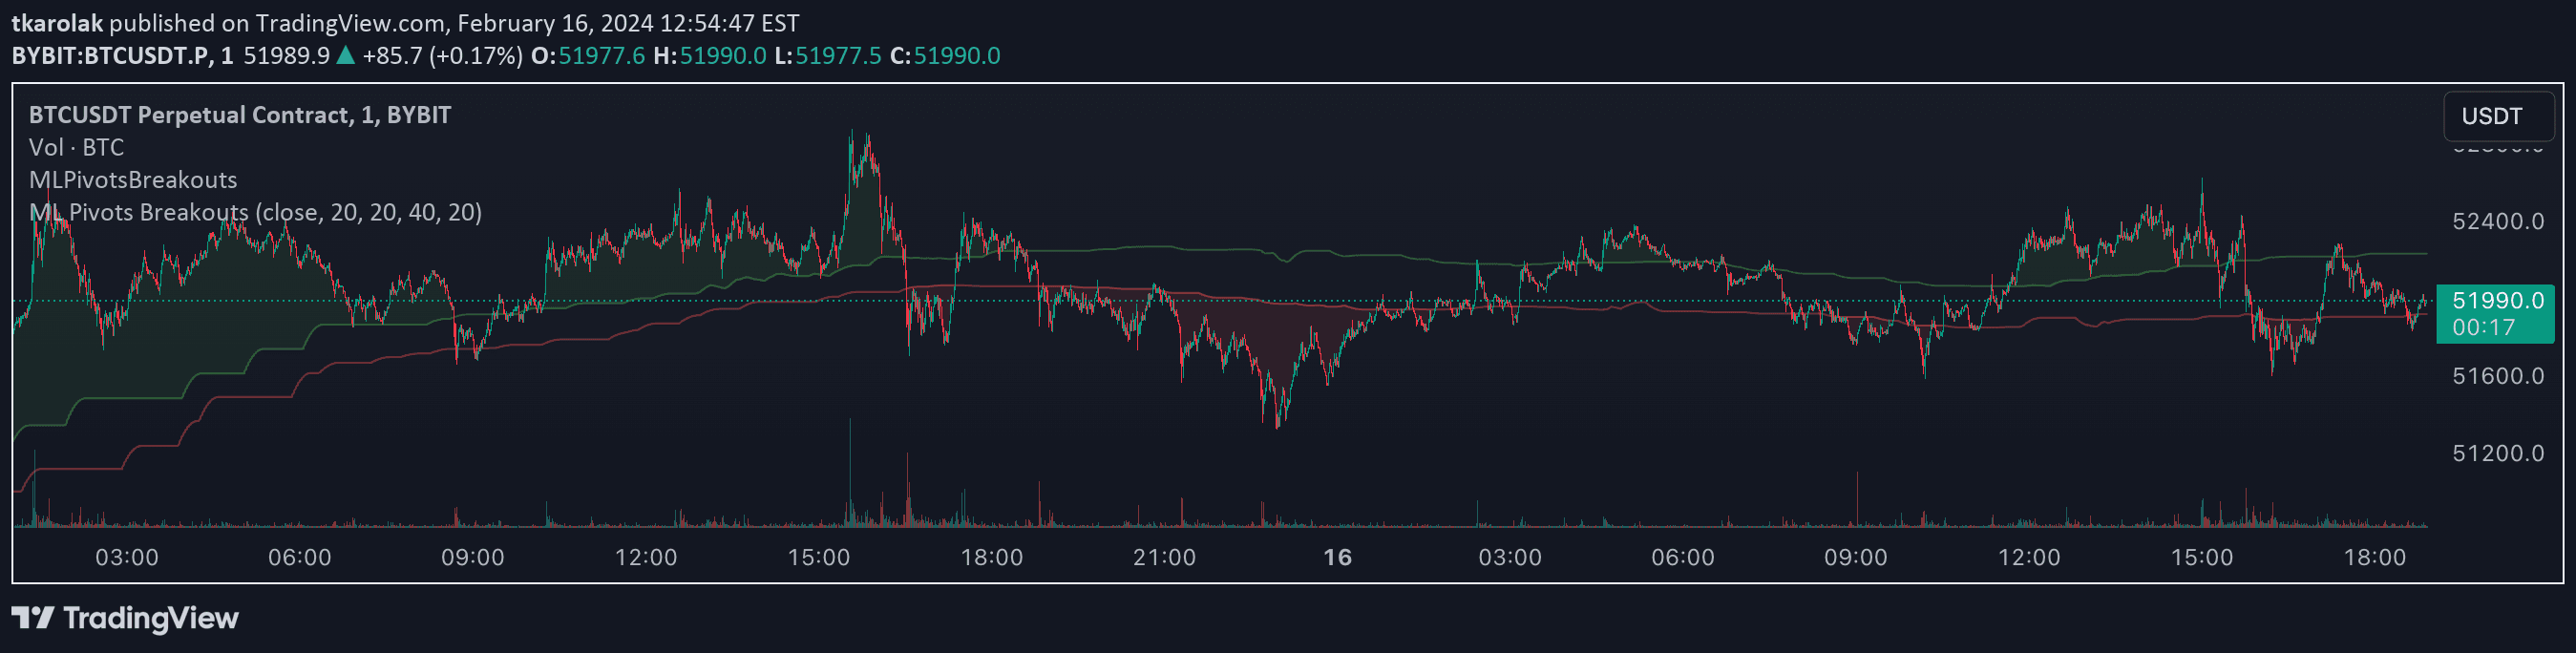
A machine learning-powered indicator using pivot points and k-Nearest Neighbors to detect potential breakout opportunities in price movements by analyzing high and low lines.
Explore complementary indicator rolesHow it works
The Machine Learning Breakouts indicator leverages k-Nearest Neighbors (k-NN) and Euclidean distance to analyze pivot points in a two-dimensional price and time space. By calculating distances between historical pivot points, the algorithm predicts potential breakout zones above and below current price levels.
The system identifies bullish and bearish breakout signals by tracking price movements relative to these machine-learned pivot lines. When price crosses above the forecasted high line, a bullish signal is generated, and when price breaks below the predicted low line, a bearish signal is triggered, helping traders identify potential entry and exit points.
Why it may be useful
This indicator provides traders with a sophisticated, data-driven approach to identifying market breakouts and trend changes using advanced machine learning techniques. By integrating k-NN algorithms with pivot point analysis, it offers a more nuanced and adaptive method of detecting potential trading opportunities compared to traditional technical analysis tools.
The Machine Learning Breakouts indicator helps traders navigate market volatility by providing clear, quantitative signals that can be applied across different trading styles and timeframes. Its ability to dynamically adjust to changing market conditions makes it a valuable tool for traders seeking to make more informed and precise trading decisions.
When to explore it
The Machine Learning Breakouts indicator is most effective in markets with clear trend potential and sufficient price volatility. It performs exceptionally well in liquid markets like forex, stocks, and futures, where price movements are more predictable and pivot points can be reliably identified.
Traders should use this indicator during periods of consolidation or when seeking to confirm potential trend reversals. It is particularly useful in identifying breakout opportunities in trending markets, helping traders enter positions at the early stages of a potential price movement and manage risk more effectively.
Keep exploring
What we’ve verified
Access, alerts and repainting behaviour have not been independently verified for this indicator. Check the creator’s current publication and settings.
General descriptions and classifications are recovered research. Verified details above identify the specific checks we have completed. Check the creator’s current publication for later changes.


