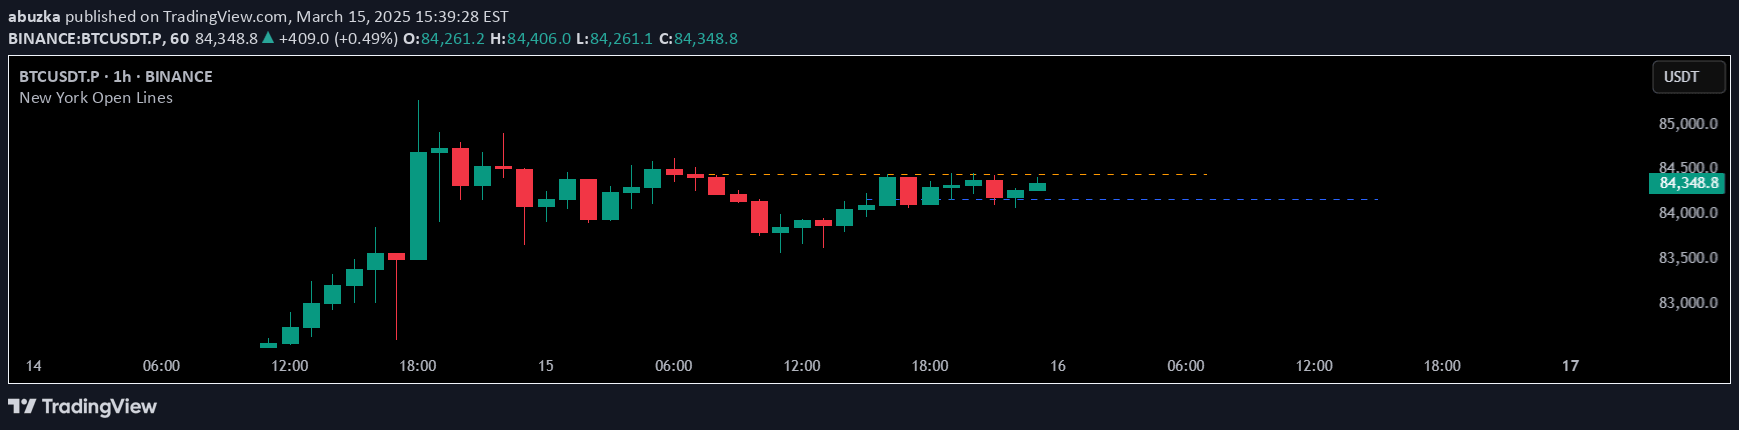
A trading indicator that displays High/Low lines for multiple trading sessions, visually highlighting key price levels and providing session-based analysis across different timeframes.
Explore complementary indicator rolesHow it works
The indicator creates multiple session-based High/Low lines that track price movements across different time periods. It dynamically displays lines for up to three days, with each session represented by a distinct color and style.
As prices interact with these lines, the visual representation changes, indicating whether specific High/Low levels have been reached. Traders can customize session times, choose color schemes, and extend unreached lines to the right side of the chart for enhanced analysis.
Why it may be useful
This indicator provides traders with a visual framework for understanding price action across multiple sessions, making it easier to identify key support and resistance levels. By highlighting session-specific High/Low points, traders can quickly recognize potential trading opportunities and price behavior patterns.
The color-changing mechanism allows traders to instantly recognize when critical price levels have been breached, offering immediate visual feedback about market dynamics and potential trend changes.
When to explore it
The indicator is most effective for traders focusing on short-term price movements and session-based analysis, particularly in markets with clear intraday trading patterns. It works best in liquid markets where session boundaries have significant price impact.
Traders can utilize this tool during active trading hours, especially when tracking multiple timeframes and seeking to understand price action relative to specific session boundaries. It is particularly useful for day traders and scalpers who require precise, real-time price level tracking.
Keep exploring
What we’ve verified
Access, alerts and repainting behaviour have not been independently verified for this indicator. Check the creator’s current publication and settings.
General descriptions and classifications are recovered research. Verified details above identify the specific checks we have completed. Check the creator’s current publication for later changes.