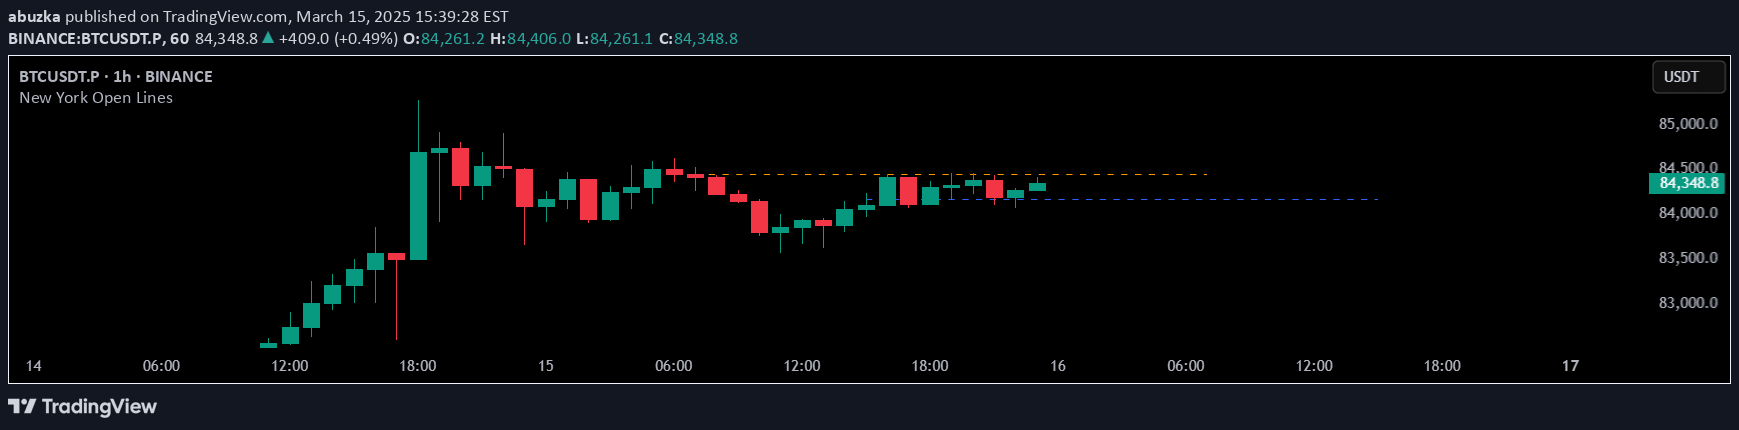
A trading indicator that marks key New York trading session opens by drawing horizontal lines at specific times, helping traders identify crucial market entry and price reference points.
Explore complementary indicator rolesHow it works
The indicator identifies and plots horizontal lines at two critical New York trading session times: midnight (00:00) and economic open (08:30). For timeframes above 30 minutes, it retrieves open prices using security_lower_tf() function, ensuring prices are stored only once per day. The script ensures precise tracking by storing prices dynamically and adapting to different chart timeframes.
For timeframes of 30 minutes or less, the indicator draws lines as bars appear, providing real-time session open price references. The lines extend for 24 hours and automatically reset at the start of a new trading day, maintaining chart clarity and ensuring traders have current session information.
Why it may be useful
Identifying key trading session opens provides traders with critical reference points for market analysis and strategy development. These specific times represent potential areas of significant price action, liquidity shifts, and potential trend initiation or reversal points. Traders can use these levels to understand market sentiment, potential support and resistance zones, and make more informed trading decisions.
By marking New York session opens, the indicator helps traders synchronize their strategies with major market movements. The customizable line styles and colors allow for personalized visual interpretation, making it easier to spot important price levels and potential trading opportunities across different timeframes.
When to explore it
This indicator is most effective for traders focusing on New York market session dynamics, particularly those trading forex, futures, or stocks with significant US market exposure. It works best during active trading hours when price movements are most volatile and liquidity is highest. Traders can use these session open lines to identify potential breakout points, support and resistance levels, and assess market sentiment.
The indicator is particularly useful for day traders and scalpers who need precise entry and exit points. It helps traders understand market structure, anticipate potential price movements, and develop strategies around key session transitions. Traders can benefit from this tool across multiple timeframes, from short-term scalping to more extended day trading approaches.
Keep exploring
What we’ve verified
Access, alerts and repainting behaviour have not been independently verified for this indicator. Check the creator’s current publication and settings.
General descriptions and classifications are recovered research. Verified details above identify the specific checks we have completed. Check the creator’s current publication for later changes.