ICT Killzones + Pivots [TFO]
A customizable trading indicator designed to identify ICT Killzones and track high and low price pivots during specific market sessions with configurable time windows.
Explore 11,183 indicators. Filter beyond the obvious.
Discover the tools that fit the way you trade.
11,183 tools to explore
A customizable trading indicator designed to identify ICT Killzones and track high and low price pivots during specific market sessions with configurable time windows.
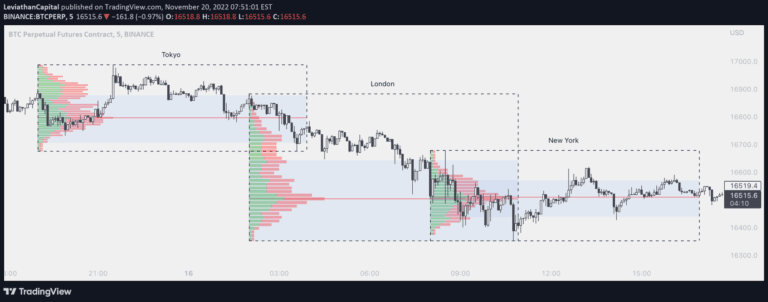
A comprehensive forex market session tracker with Volume Profile analysis that allows traders to visualize trading activity across different global market sessions and timeframes.
An advanced trading indicator that identifies potential Fair Value Gaps during specific one-hour market sessions and highlights support/resistance levels for strategic entry and exit points.
An advanced trading strategy measuring the opening range of a trading session to identify potential breakout opportunities and determine market trend direction with precise entry and exit points.
Advanced trading indicator providing comprehensive market structure analysis with customizable sensitivities, identifying price action patterns, order blocks, and session dynamics for strategic trading decisions.
Day Trading Booster is a comprehensive trading tool designed to help traders identify optimal market entry and exit points by analyzing trading sessions, market volumes, and key price levels.
An FX market indicator that segments trading times into specific zones, providing visual guidance for traders using timeframes of 60 minutes or less.
A customizable market session tracker displaying trading hours for Tokyo, London, New York, and Sydney with multiple visualization options and advanced trading insights.
A trading indicator that identifies the first fair value gap in a trading session, highlighting price imbalances and potential support/resistance zones with customized alerts.
An advanced Opening Range Breakout (ORB) indicator that analyzes market trends in the first session minutes, providing precise entry, take-profit, and stop-loss signals.
A custom volume profile indicator that visualizes trading volume across custom time periods, splitting each period into halves and displaying volume and sentiment through color-coded histograms.
An advanced charting tool measuring liquidity and market sentiment by analyzing price and volume data across different anchoring periods to reveal significant trading levels.
Likes, views, and comments are historical TradingView snapshots. They describe attention, not trading performance.