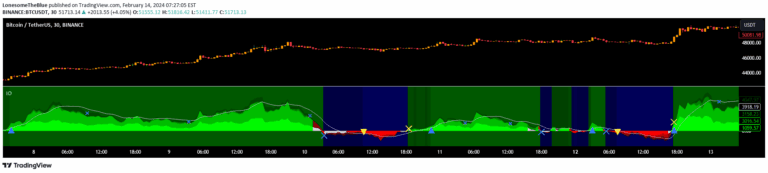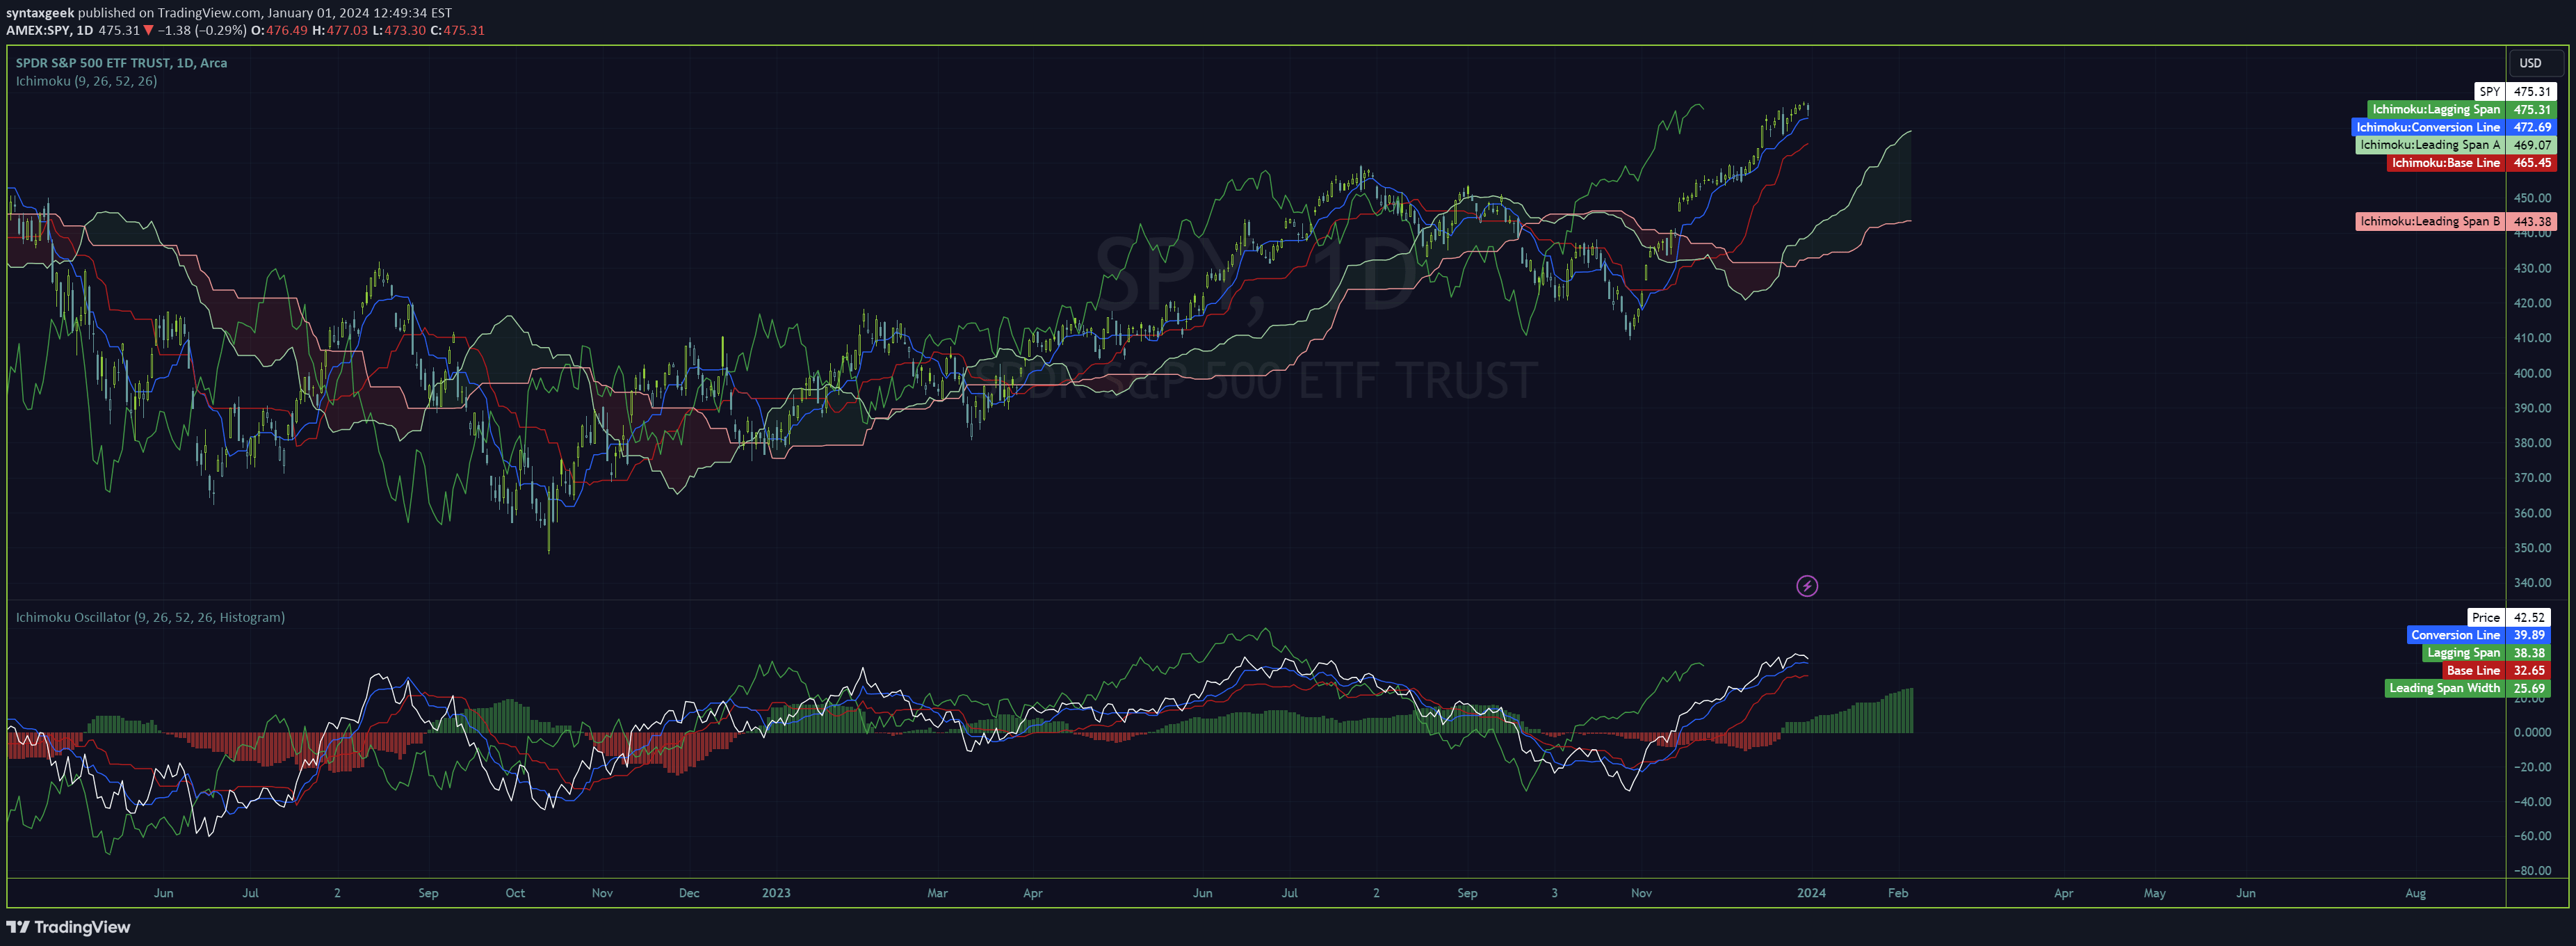
A modified Ichimoku cloud indicator that converts the cloud into an oscillation histogram, providing a cleaner chart display while maintaining key signal components and price relationship insights.
Explore complementary indicator rolesHow it works
The Ichimoku cloud oscillation indicator calculates price dynamics by performing an absolute subtraction between span A and span B lines, transforming the traditional cloud representation into a histogram format. This approach creates an alternative width detection mechanism that maintains the core principles of the original Ichimoku indicator while offering a more streamlined visual representation.
By removing the cloud from the main chart, the indicator focuses on positional accuracy through the 'Price' plot, which tracks the relationship between price and oscillation values. The modified display allows traders to observe cross signals and understand price location relative to key technical levels more intuitively.
Why it may be useful
The modified Ichimoku oscillation indicator provides traders with a cleaner, more focused view of market trends and momentum without the visual complexity of the traditional cloud representation. By simplifying the technical analysis tool, traders can more easily interpret signals and price relationships, potentially reducing chart clutter and improving decision-making clarity.
This approach maintains the core analytical strength of the Ichimoku system while offering a more minimalist presentation. The oscillation format allows for easier identification of trend changes, momentum shifts, and potential entry or exit points across different trading timeframes.
When to explore it
The Ichimoku cloud oscillation indicator is most effective in markets with clear trending characteristics, such as forex, cryptocurrency, and major stock index markets. Traders can leverage this tool during periods of consistent price movement, where the oscillation can provide clear signals about trend strength and potential reversals.
The indicator works particularly well in volatile markets where traditional cloud representations might become visually overwhelming. Ideal usage includes timeframes ranging from short-term scalping to longer-term swing trading, offering flexibility across different trading strategies and market conditions.
Keep exploring
What we’ve verified
Access, alerts and repainting behaviour have not been independently verified for this indicator. Check the creator’s current publication and settings.
General descriptions and classifications are recovered research. Verified details above identify the specific checks we have completed. Check the creator’s current publication for later changes.