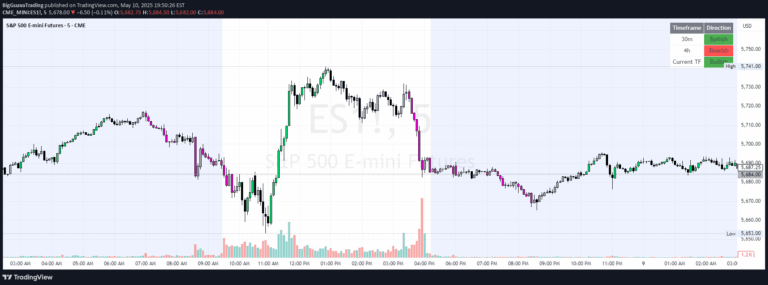
A trading strategy that identifies specific candlestick formations across multiple timeframes to help traders recognize potential price action setups and market dynamics.
Explore complementary indicator rolesHow it works
The Strat trading signal analyzes price action by categorizing bars into specific types: Inside Bars (1), Continuation Up Bars (2u), Continuation Down Bars (2d), and Outside Bars (3). It creates a multi-timeframe dashboard that tracks these bar types across four selected timeframes, displaying visual indicators and color-coded signals.
The system uses arrows and background colors to represent price movements, with green up arrows indicating price above candle open and red down arrows showing price below candle open. Each timeframe is evaluated independently, allowing traders to quickly understand market dynamics across different time horizons.
Why it may be useful
This trading signal provides traders with a comprehensive view of market behavior by breaking down price action into easily recognizable patterns. By visualizing bar types and their relationships across multiple timeframes, traders can make more informed decisions about potential entry and exit points.
The dashboard's color-coded and arrow-based system simplifies complex price action analysis, allowing traders to quickly assess market conditions without extensive manual calculation. This approach helps traders identify potential trading opportunities more efficiently and systematically.
When to explore it
The Strat trading signal is most effective in markets with clear directional movements and distinct price action patterns. It works best for traders who prefer a systematic approach to analyzing price behavior across different timeframes, particularly in volatile or trending markets.
Traders can utilize this signal during periods of market transition, when identifying potential trend reversals or continuations is crucial. It is particularly useful for active traders who need quick, visual representations of market dynamics across multiple time horizons.
Keep exploring
What we’ve verified
Access, alerts and repainting behaviour have not been independently verified for this indicator. Check the creator’s current publication and settings.
General descriptions and classifications are recovered research. Verified details above identify the specific checks we have completed. Check the creator’s current publication for later changes.