SuperTrend AI (Clustering) [LuxAlgo]
SuperTrend AI is an advanced machine learning technique that applies K-means clustering to the SuperTrend indicator, dynamically adapting trailing stop settings based on performance metrics.
Explore 11,183 indicators. Filter beyond the obvious.
Discover the tools that fit the way you trade.
11,183 tools to explore
SuperTrend AI is an advanced machine learning technique that applies K-means clustering to the SuperTrend indicator, dynamically adapting trailing stop settings based on performance metrics.
Breakout Probability indicator calculates the likelihood of new market highs or lows by analyzing historical price action and displaying percentage probabilities for potential price levels.
PMax Explorer is a trading strategy that combines moving stop loss and SuperTrend indicators to generate reliable buy and sell signals for trend identification and potential reversals.
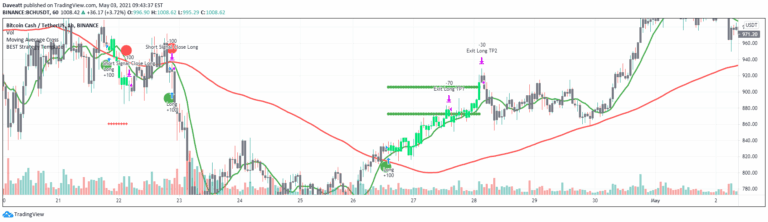
An advanced all-in-one trading strategy builder that combines over 30 indicators to generate custom buy and sell signals across multiple timeframes and trading styles.
A universal strategy template for TradingView that allows traders to convert any indicator into a tradable strategy with comprehensive risk management and backtesting features.
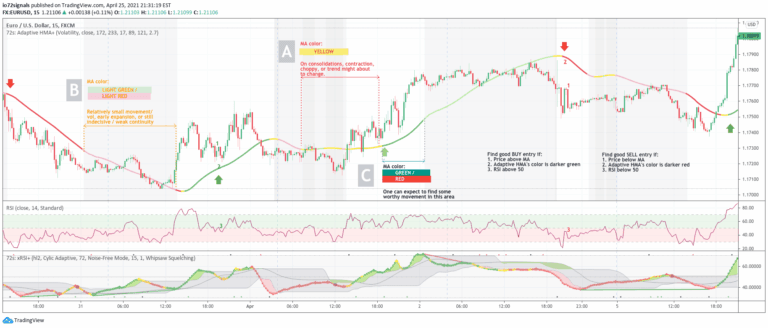
An adaptive Hull Moving Average that dynamically adjusts its period based on volume and volatility, providing clearer trend signals and market condition insights for traders.
SuperBollingerTrend combines Bollinger Bands and SuperTrend to analyze market volatility and trend direction, providing traders insights into potential trend changes and breakouts.
A market structure indicator using fractal patterns to detect trend changes, support/resistance levels, and market reversals with adaptive analysis of price movements.
Renko Candles Overlay is a charting technique that transforms price action into uniform-sized bricks, offering a simplified visual representation of market trends and price movements.
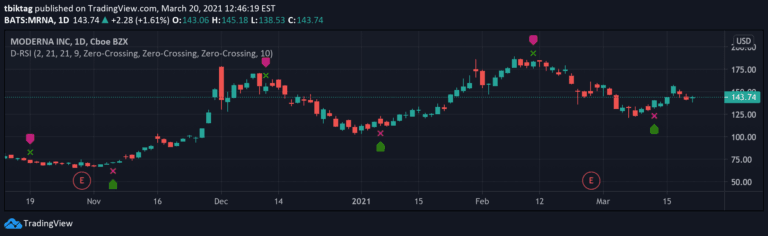
Delta-RSI Oscillator is a momentum indicator that measures the rate of change in RSI through a smoothed time derivative, providing dynamic insights into market momentum shifts.
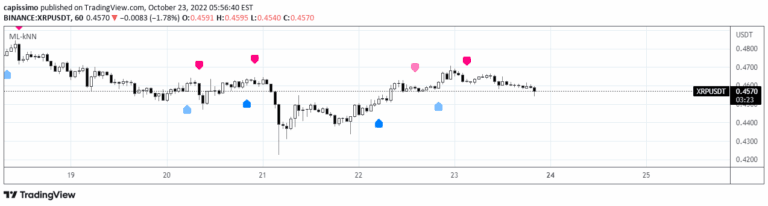
A k-Nearest Neighbours machine learning strategy that predicts market moves by analyzing historic data and finding similar past market conditions to forecast future price directions.
An experimental trading signal applying the Logistic Map Equation to popular indicators like Awesome Oscillator, ROC, RSI, and Stochastic to generate unique market insights through iterative mathematical calculations.
Likes, views, and comments are historical TradingView snapshots. They describe attention, not trading performance.