HEMA Trend Levels [AlgoAlpha]
A dynamic trend analysis tool using Hull-EMA curves that color-codes price bars, plots support/resistance boxes, and identifies high-probability breakout retests for traders.
Explore 11,183 indicators. Filter beyond the obvious.
Discover the tools that fit the way you trade.
11,183 tools to explore
A dynamic trend analysis tool using Hull-EMA curves that color-codes price bars, plots support/resistance boxes, and identifies high-probability breakout retests for traders.
A multi-timeframe candle visualization tool that allows flexible display of historical price data with pivot point calculations and customizable viewing options.
A trading dashboard tracking multiple signals with advanced price action analysis, highlighting reversal patterns, timeframe continuity, and key market indicators.
A multi-timeframe MACD indicator that provides real-time trend analysis across different timeframes without manually switching charts, enabling more comprehensive trend confirmation.
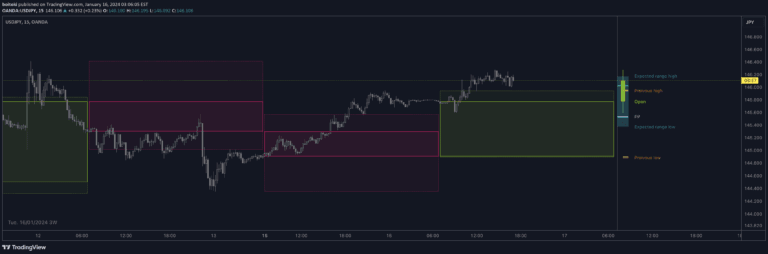
A timeframe continuity indicator that visualizes price positioning relative to multiple timeframe opens, helping traders understand market momentum and potential range limitations.
A candle strength oscillator measuring the difference between candle body and total range, using smoothed HMA to analyze price movement dynamics and potential market exhaustion.
A Supertrend-based indicator that analyzes consecutive candlestick patterns and predicts potential bullish or bearish movements using advanced probabilistic calculations.
Advanced Heikin-Ashi RSI Oscillator that transforms RSI into candle representations, providing deep insights into market momentum, trend states, and potential reversals.
A multi-timeframe analysis indicator that checks price alignment across different time periods to confirm trend strength and generate buy or sell signals.
An advanced trading indicator that automatically identifies head and shoulders chart patterns, highlighting potential price trend reversals and projecting possible price movements based on pattern ranges.
VWAP calculates the volume-weighted average price, helping traders understand price trends by integrating trading volume and price data across a specific time frame.
A trading indicator for The Strat that identifies precise entry and exit points while detecting time frame continuity across multiple market contexts.
Likes, views, and comments are historical TradingView snapshots. They describe attention, not trading performance.