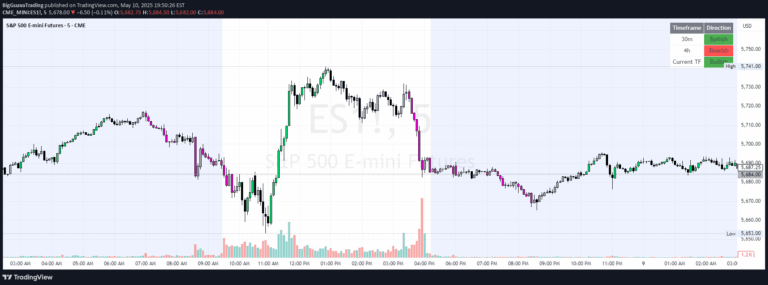
A multi-timeframe analysis indicator that checks price alignment across different time periods to confirm trend strength and generate buy or sell signals.
Explore complementary indicator rolesHow it works
The time frame continuity indicator systematically examines price movements across multiple timeframes, ranging from 5-minute to daily charts. It checks whether the current price is above or below the opening price for each selected timeframe, creating a comprehensive trend analysis.
When all selected timeframes align in a bullish or bearish direction, the indicator generates a corresponding buy or sell signal. Traders can customize the analysis by selecting up to 10 different timeframes, with the recommended set including 15m, 30m, 1H, 4H, D, 5D, and W charts for a robust short-term trend assessment.
Why it may be useful
Time frame continuity provides traders with a robust method to confirm trend strength and reduce trading risks by ensuring multiple timeframes support the same directional bias. By aligning price movements across different periods, traders can gain greater confidence in their trading decisions and filter out potentially unreliable signals.
The approach helps traders avoid trading against the dominant trend and provides a more comprehensive view of market dynamics. It allows for a more systematic and disciplined trading strategy by requiring confirmation from multiple timeframes before executing a trade.
When to explore it
This indicator works best in markets with clear and sustained trends, where price movements show consistent direction across multiple timeframes. It is particularly effective for traders seeking to minimize false signals and enhance their trend-following strategies across various financial instruments.
The time frame continuity approach is most valuable during periods of strong market momentum, whether in bullish or bearish conditions. Traders should apply this technique when they want to validate trend strength, reduce emotional decision-making, and create a more systematic approach to identifying high-probability trading opportunities.
Keep exploring
What we’ve verified
Access, alerts and repainting behaviour have not been independently verified for this indicator. Check the creator’s current publication and settings.
General descriptions and classifications are recovered research. Verified details above identify the specific checks we have completed. Check the creator’s current publication for later changes.