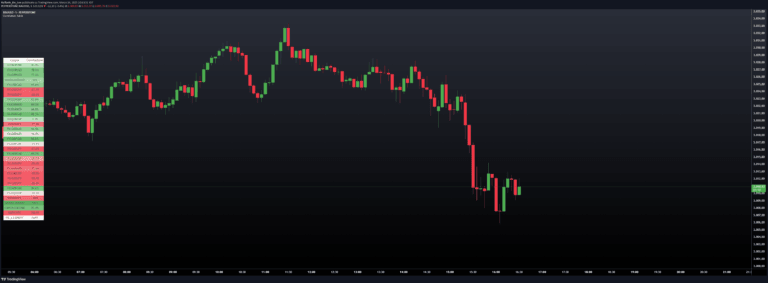
Correlation Drift analyzes the relationship between an asset's price movement and a benchmark, revealing momentum shifts and trend alignment through a dynamic correlation and price lag ratio.
Explore complementary indicator rolesHow it works
The Correlation Drift indicator calculates the correlation between an asset and a benchmark over a specified period, measuring how closely their price movements align. It then determines the Price Lag Factor (PLF) by analyzing the difference between long-term and short-term price momentum, dynamically scaled by recent volatility.
By combining these metrics, the indicator creates a smoothed histogram that visualizes the asset's momentum relative to the trend. The resulting Correlation vs PLF Ratio provides traders with a nuanced view of potential momentum shifts, with values ranging from bullish to bearish and color-coded for easy interpretation.
Why it may be useful
The Correlation Drift indicator offers traders a sophisticated tool for understanding market dynamics beyond traditional trend analysis. By quantifying the relationship between an asset's price movement and a benchmark, it provides insights into momentum alignment that can be crucial for making informed trading decisions.
This approach allows traders to detect subtle shifts in market sentiment before they become apparent through more conventional indicators. The visual representation helps quickly identify potential trend changes, giving traders a competitive edge in understanding complex market movements and potential entry or exit points.
When to explore it
The Correlation Drift indicator is most effective in markets with clear trending characteristics, such as cryptocurrency, forex, and liquid stock markets. It works best when combined with other technical analysis tools, providing confirmation of potential trend shifts and momentum changes.
Traders should pay special attention to transitions between positive and negative values, which can signal important trend reversals. The indicator is particularly useful during periods of market volatility, helping to distinguish between temporary price fluctuations and more significant trend changes.
Keep exploring
What we’ve verified
Access, alerts and repainting behaviour have not been independently verified for this indicator. Check the creator’s current publication and settings.
General descriptions and classifications are recovered research. Verified details above identify the specific checks we have completed. Check the creator’s current publication for later changes.