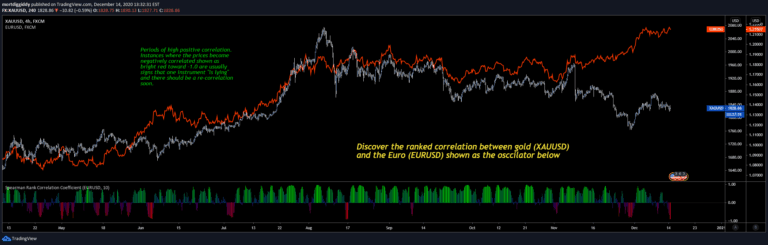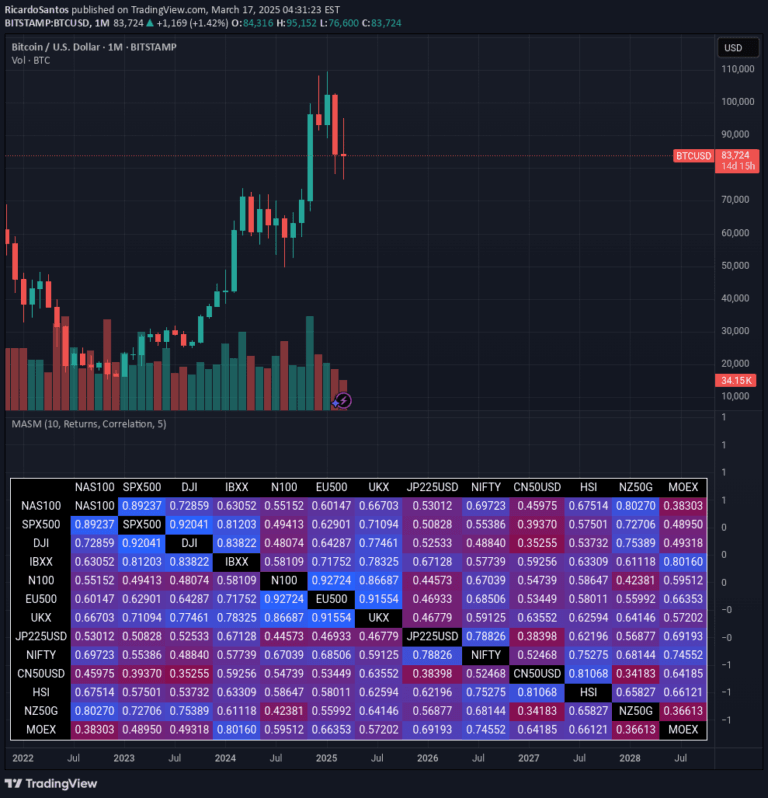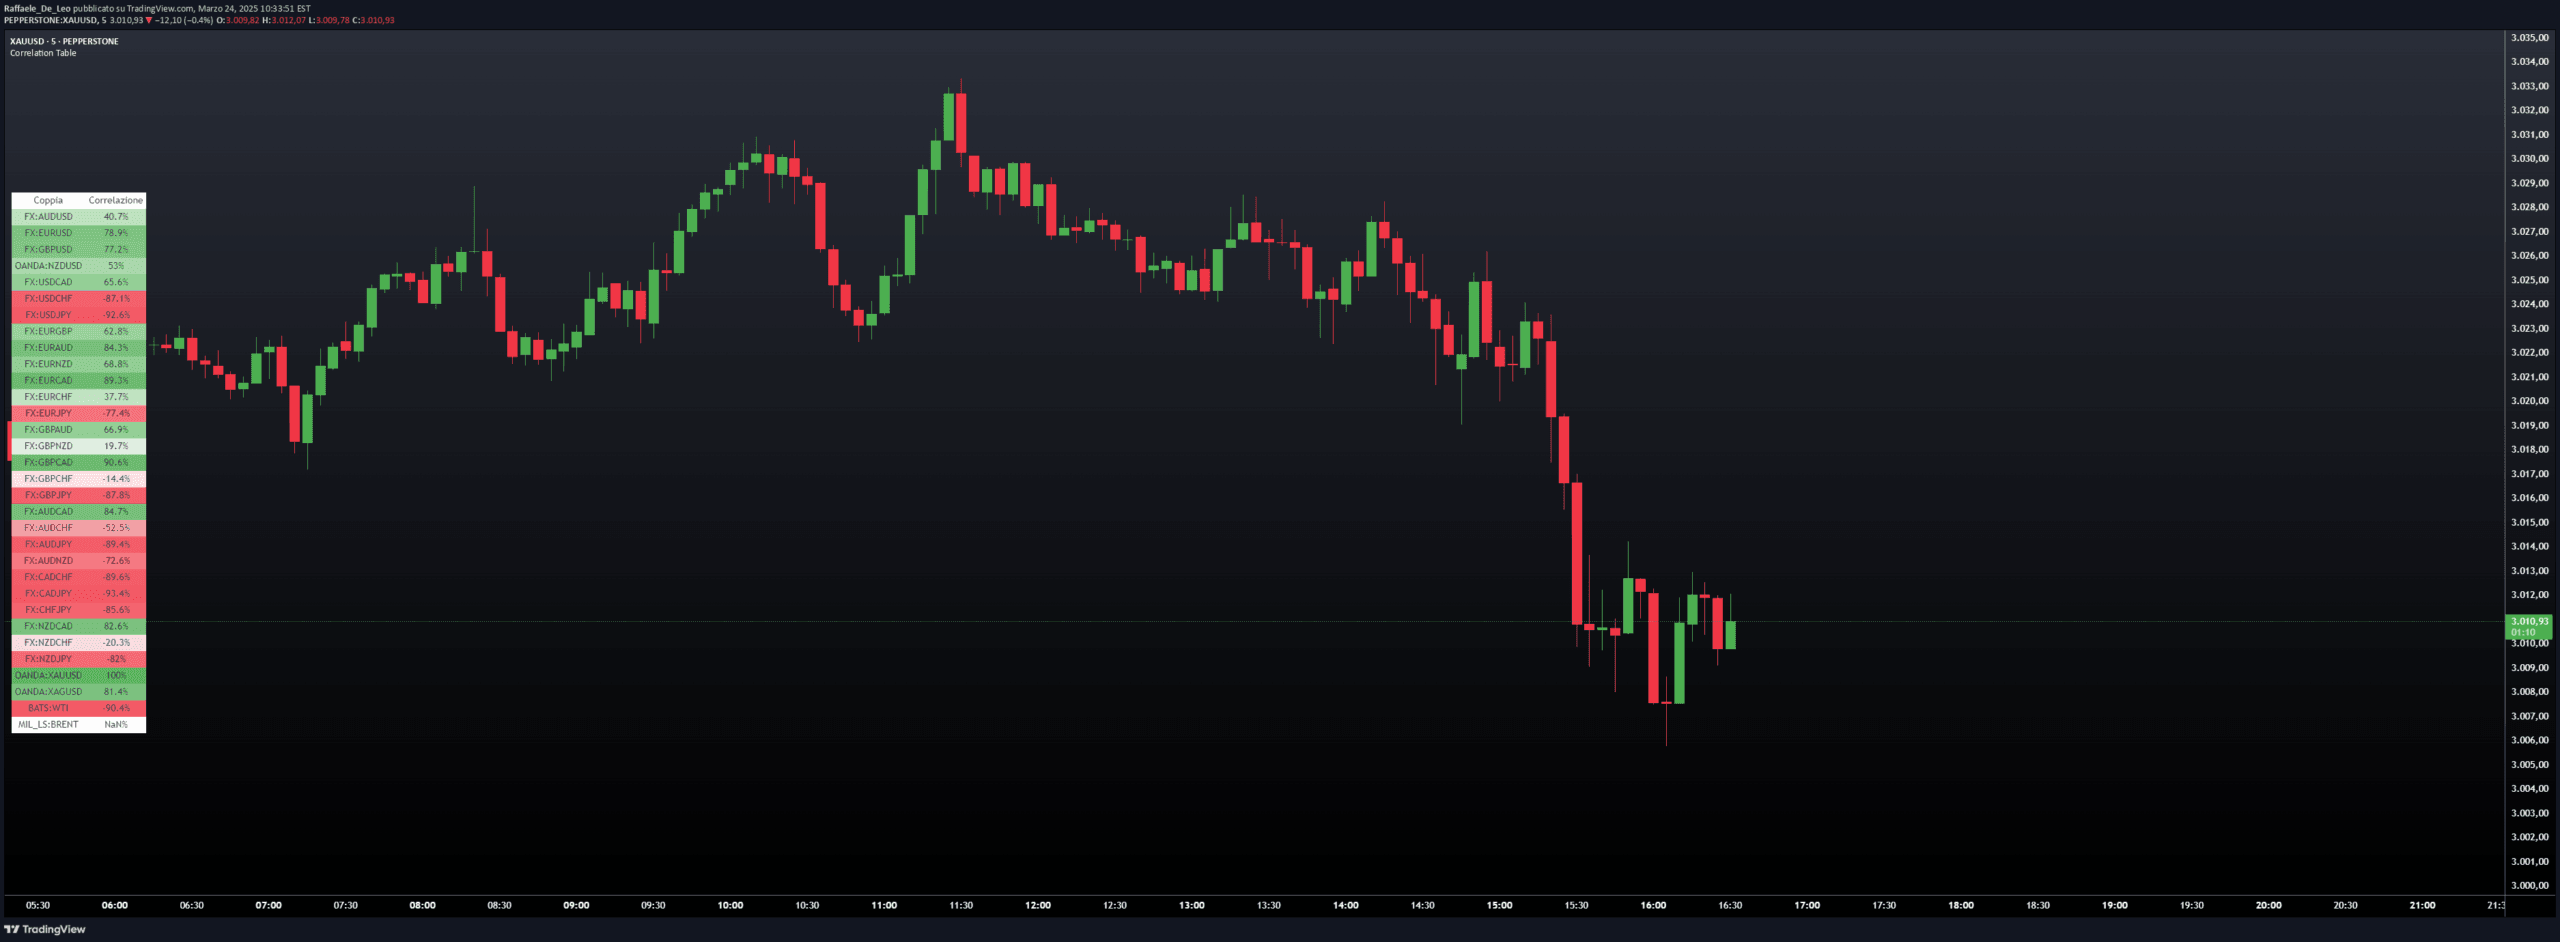
A comprehensive correlation indicator that compares an asset's price movement with up to 32 other trading pairs, offering visual insights into market relationships and potential trading opportunities.
Explore complementary indicator rolesHow it works
The correlation indicator calculates the statistical relationship between the current chart's asset and selected trading pairs over a customizable lookback period. It allows traders to choose up to 32 symbols for comparison, with optional EMA smoothing to refine price data.
The indicator computes the correlation coefficient, which ranges from -1 to +1, representing perfect negative to perfect positive correlation. Each pair's correlation is displayed in a vertical table with color-coded cells indicating the strength and direction of the relationship
Why it may be useful
Understanding market correlations is crucial for risk management and strategic trading decisions. This indicator helps traders identify how different financial instruments move in relation to each other, revealing potential hedging opportunities or confirming trading signals.
By visualizing correlations across multiple pairs, traders can gain insights into broader market dynamics, diversify their portfolios, and develop more sophisticated trading strategies. The color-coded display makes it easy to quickly interpret complex statistical relationships
When to explore it
This correlation indicator is most valuable during periods of market uncertainty or when analyzing cross-asset relationships. Traders should use it when exploring potential diversification strategies, assessing portfolio risk, or looking for confirming signals across different financial instruments.
It's particularly useful for forex traders, multi-asset investors, and those interested in understanding how different markets interact. The tool can help identify potential leading or lagging indicators and provide context for trading decisions
Keep exploring
What we’ve verified
Access, alerts and repainting behaviour have not been independently verified for this indicator. Check the creator’s current publication and settings.
General descriptions and classifications are recovered research. Verified details above identify the specific checks we have completed. Check the creator’s current publication for later changes.