Normalized Global Net Liquidity + HMA Smoothed RoC
A comprehensive liquidity indicator analyzing global financial trends by combining multiple metrics and normalizing them into a single visualization tool for market analysis.
Explore 11,183 indicators. Filter beyond the obvious.
Discover the tools that fit the way you trade.
11,183 tools to explore
A comprehensive liquidity indicator analyzing global financial trends by combining multiple metrics and normalizing them into a single visualization tool for market analysis.
Advanced market regime classifier that analyzes multiple statistical indicators to generate a composite score, dynamically classifying market conditions across different states from bullish to bearish.
A dynamic indicator that normalizes price action slope using ATR, categorizing momentum into six intensity levels with color-coded visualization and real-time alerts.
A comprehensive trading indicator analyzing rate of change across multiple cryptocurrency pairs, providing insights into market trends through volume, relative strength, and timeframe-weighted calculations.
A custom technical indicator that measures price momentum by analyzing the relationship between candle body spread and total range, providing traders with visual insights into market dynamics and directional strength.
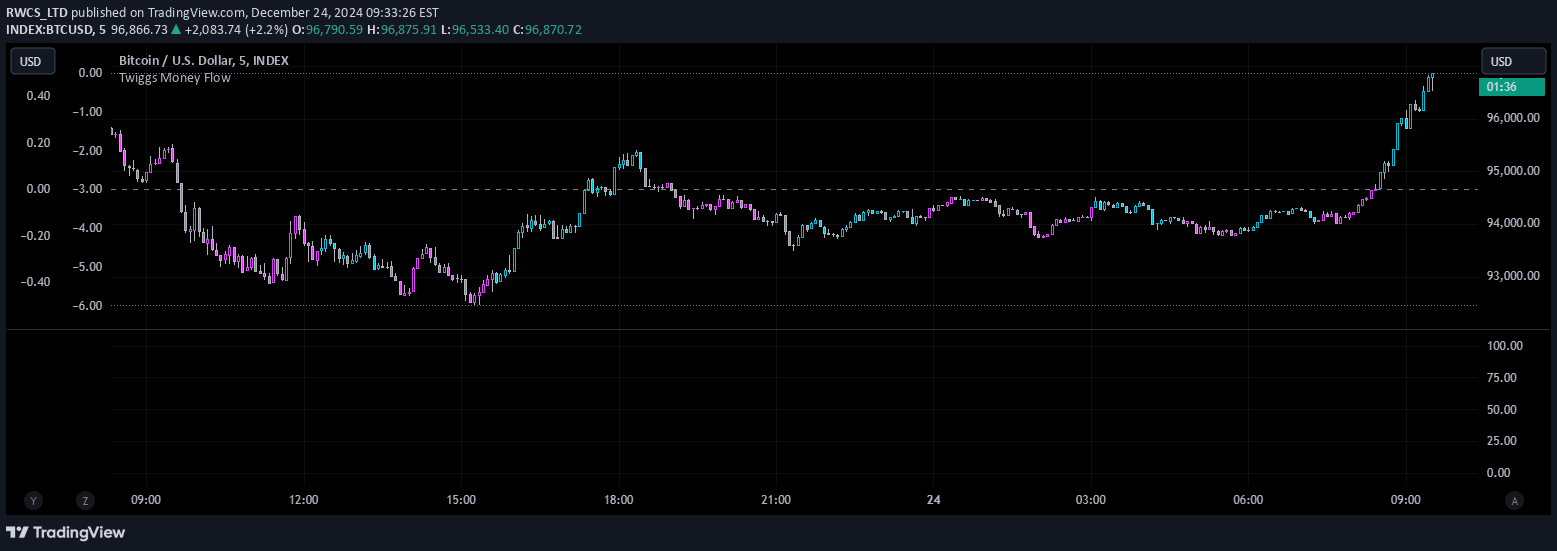
Twiggs Money Flow is a volume-based indicator that measures buying and selling pressure by analyzing price, volume, and market momentum using advanced smoothing techniques.
The Price Lag Factor (PLF) is a momentum indicator that measures the difference between long-term and short-term price movements, helping traders identify trend strength and potential market reversals.
A statistical indicator that identifies potential trend reversals by analyzing divergences between price action and the standard deviation of returns, highlighting market momentum shifts.
A trading tool that visualizes global market sessions and their overlaps, helping traders identify key trading periods and potential market activity across different time zones.
The Statistical Reliability Index (SRI) is an advanced financial analysis tool that assesses market stability, combining statistical methods to evaluate trend consistency and potential price movements.
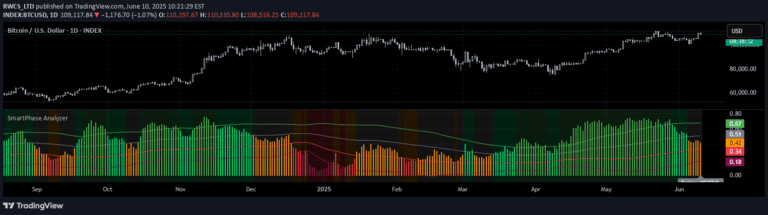
A multi-factor technical indicator measuring trend strength and market structure through statistical analysis, providing a normalized score between 0 and 1 to assess price movement quality.
Correlation Drift analyzes the relationship between an asset's price movement and a benchmark, revealing momentum shifts and trend alignment through a dynamic correlation and price lag ratio.
Likes, views, and comments are historical TradingView snapshots. They describe attention, not trading performance.