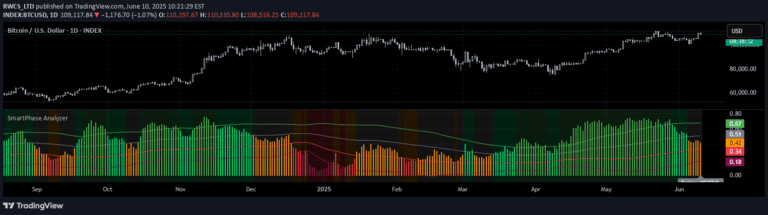
A multi-factor technical indicator measuring trend strength and market structure through statistical analysis, providing a normalized score between 0 and 1 to assess price movement quality.
Explore complementary indicator rolesHow it works
The TSI with Dynamic Bands calculates trend strength by integrating multiple quantitative metrics into a single normalized score. It first computes the Hurst exponent to determine trend persistence, then analyzes risk-adjusted volatility using the inverted Coefficient of Variation.
The indicator then incorporates momentum strength through directional momentum and Z-score normalized returns. These components are mathematically normalized and averaged to create the TSI line, which ranges from 0 to 1, representing the statistical quality of price movement.
Why it may be useful
The TSI with Dynamic Bands provides traders with a sophisticated, multi-dimensional view of market dynamics beyond traditional single-metric indicators. By combining trend persistence, volatility, and momentum into a unified score, it offers a more nuanced understanding of price action and potential market transitions.
This comprehensive approach helps traders filter out market noise, identify high-probability trading opportunities, and make more informed decisions by quantifying the underlying statistical structure of price movements across different market conditions.
When to explore it
The TSI with Dynamic Bands is most effective in markets with clear directional movements and when traders seek to confirm trend quality before entering positions. It works particularly well in liquid markets with sufficient price data to generate statistically meaningful calculations.
Traders can leverage this indicator during ranging and trending market conditions, using its adaptive bands and signal strength features to identify potential reversal zones, validate momentum, and assess the reliability of current price action.
Keep exploring
What we’ve verified
Access, alerts and repainting behaviour have not been independently verified for this indicator. Check the creator’s current publication and settings.
General descriptions and classifications are recovered research. Verified details above identify the specific checks we have completed. Check the creator’s current publication for later changes.