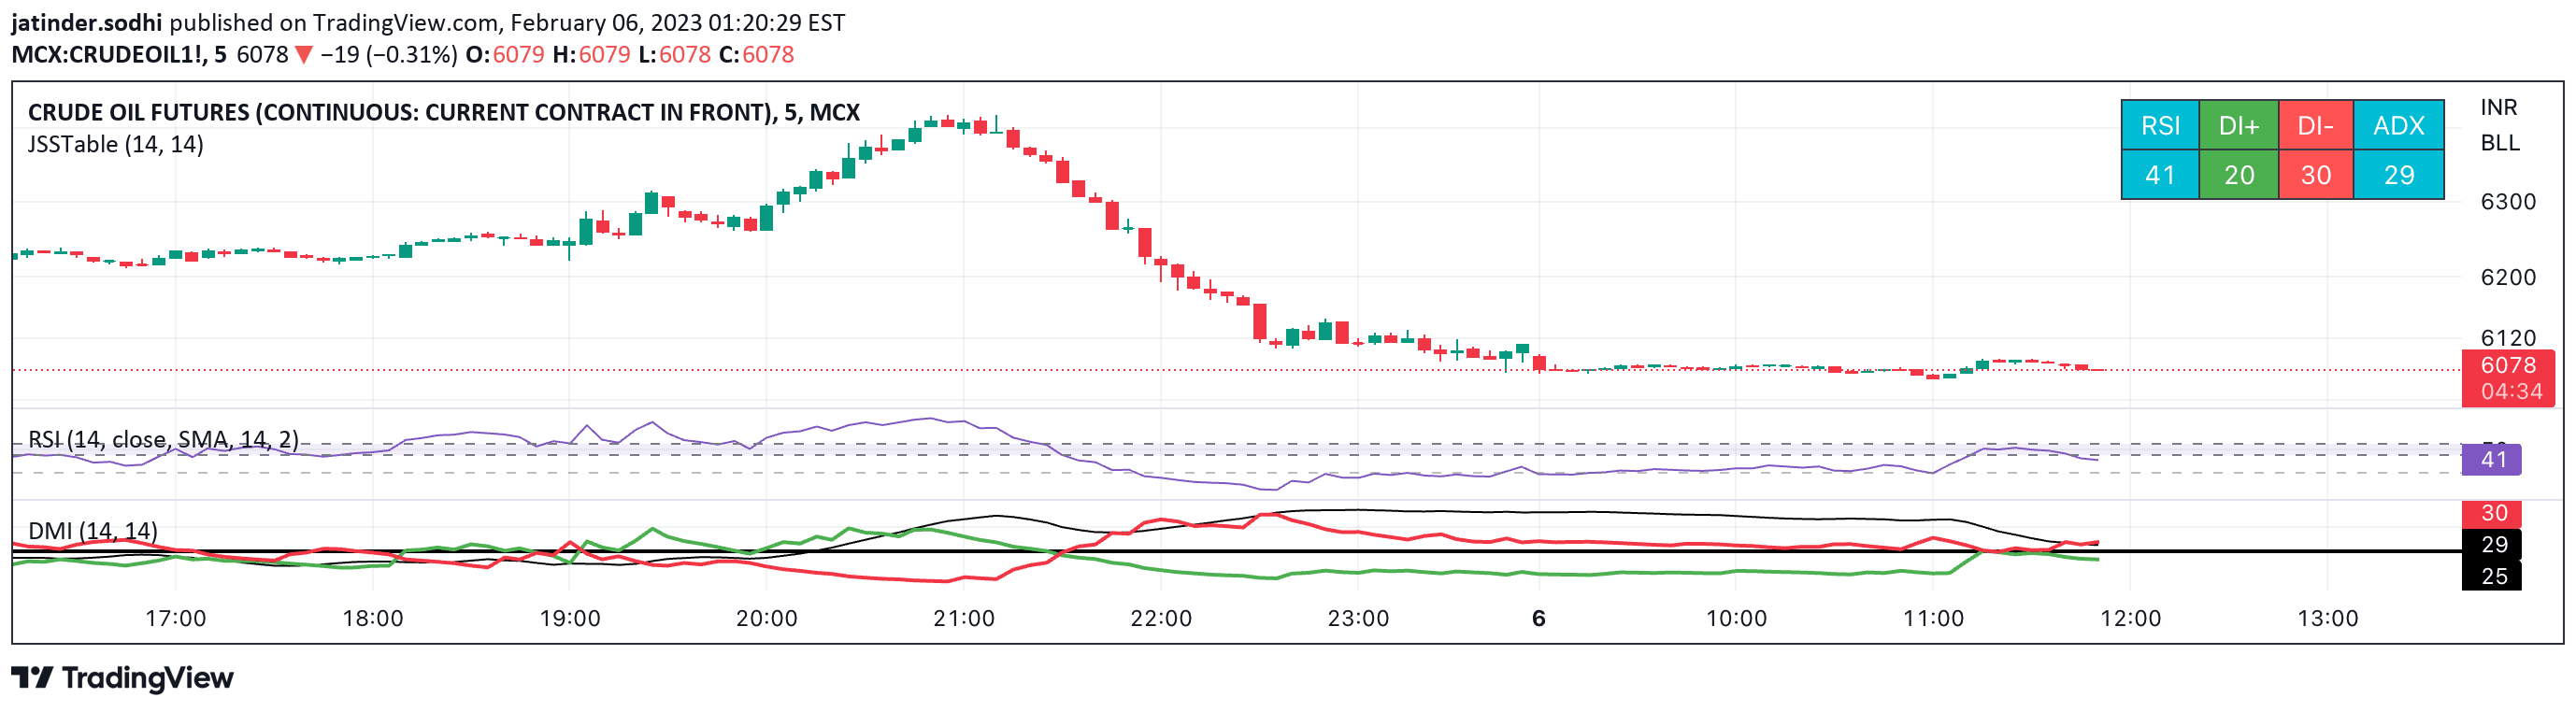
The Dynamic ADX Histogram (DADX) is an enhanced version of the ADX oscillator that provides more intuitive insights into trend direction and strength using directional movement indicators.
Explore complementary indicator rolesHow it works
The Dynamic ADX Histogram (DADX) calculates trend direction and strength by comparing smoothed Directional Movement Index (DMI+) and DMI- values. It creates a centered oscillator that shows price movement direction through the sign of the indicator and trend strength through its absolute value.
The oscillator uses user-defined length parameters for DMI calculation and optional smoothing to reduce noise. By applying directional information from DMI+ and DMI- to the Average Directional Index (ADX), the DADX provides a more comprehensive view of market momentum and trend characteristics.
Why it may be useful
Traditional ADX and DMI indicators can be challenging to interpret, often requiring complex analysis of multiple components. The DADX simplifies this process by consolidating directional and strength information into a single, easy-to-read oscillator that provides immediate visual insights into market trends.
By color-coding the histogram based on trend strength and using dynamic thresholds, traders can quickly identify trend initiation, continuation, and potential exhaustion points. This approach makes trend analysis more accessible and helps traders make more informed decisions about market conditions.
When to explore it
The DADX works best in markets with clear trending characteristics, such as forex, futures, and stocks with consistent directional movements. It is particularly useful for traders seeking to identify the onset of new trends, assess trend strength, and anticipate potential trend reversals or consolidation periods.
The indicator's flexibility in adjusting smoothing and threshold parameters allows traders to optimize its performance across different timeframes and market conditions. By customizing the low and high thresholds, traders can adapt the DADX to their specific trading style and the unique characteristics of the financial instruments they trade.
Keep exploring
What we’ve verified
Access, alerts and repainting behaviour have not been independently verified for this indicator. Check the creator’s current publication and settings.
General descriptions and classifications are recovered research. Verified details above identify the specific checks we have completed. Check the creator’s current publication for later changes.