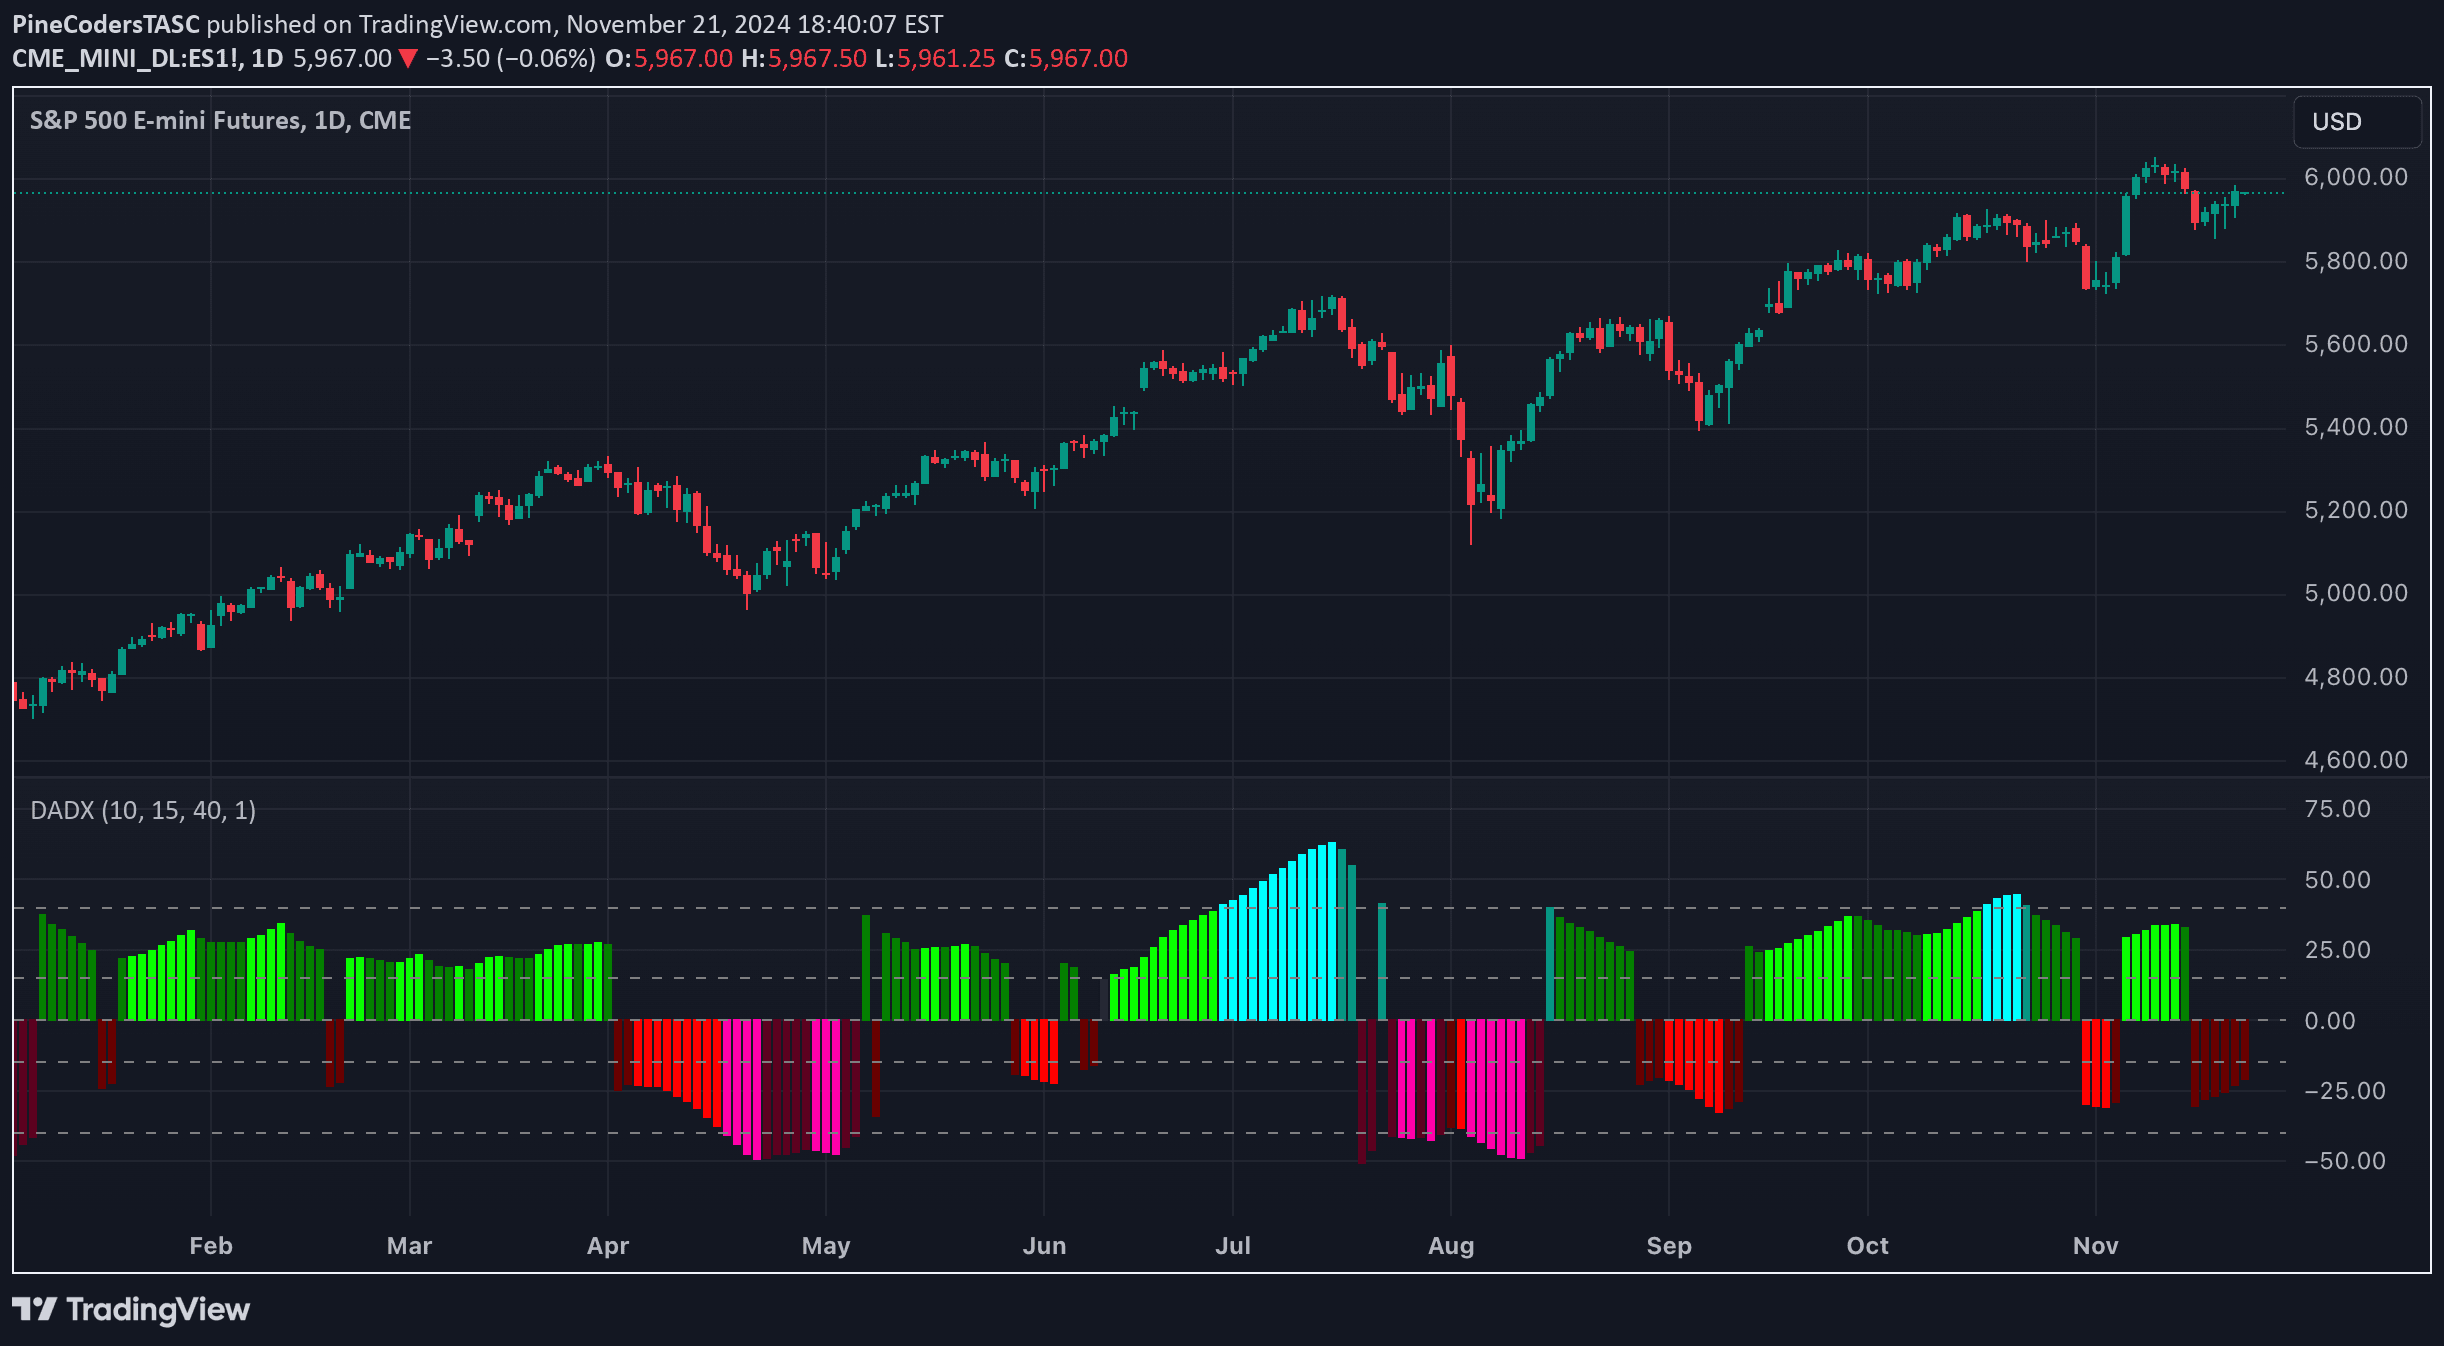
A sophisticated directional movement indicator using Hann windowing to analyze market trends. It enhances traditional Directional Movement Index (DMI) calculations through advanced smoothing techniques.
Explore complementary indicator rolesHow it works
The Directional Movement w/Hann indicator begins by calculating traditional Plus and Minus Directional Movements (PlusDM and MinusDM) as foundational components. These directional movements are then aggregated using an exponential moving average (EMA) to create a smoothed trend representation. The EMA is further refined through a finite impulse response (FIR) filter utilizing Hann window coefficients, which helps reduce noise and enhance signal clarity.
The indicator applies mathematical windowing techniques to modify the traditional DMI calculation, providing a more nuanced view of market directionality. By applying these advanced smoothing techniques, the indicator creates a refined trend analysis tool that can adapt to changing market conditions
Why it may be useful
Traders benefit from this indicator's sophisticated approach to trend analysis by gaining a more precise understanding of market momentum and directional shifts. The Hann windowing technique helps filter out market noise, allowing for clearer trend identification. By combining traditional directional movement principles with advanced smoothing algorithms, the indicator provides a more robust method of trend detection.
It offers traders a nuanced perspective on market trends that goes beyond basic directional movement measurements. The enhanced calculation method can help reduce false signals and improve trend confirmation. This approach makes the indicator particularly valuable for traders seeking more refined trend analysis tools
When to explore it
The Directional Movement w/Hann indicator is most effective in markets with clear trending characteristics, such as forex, commodities, and certain stock indices. It performs best during periods of sustained directional price movement, where trend strength and momentum are key considerations. Traders should utilize this indicator when seeking to confirm trend direction and assess momentum strength across different timeframes.
It is particularly useful during market conditions with moderate volatility, where trend persistence is more apparent. The indicator can be especially valuable when combined with other trend-confirming tools to validate trading signals. Optimal usage occurs when traders are looking for a more sophisticated approach to trend analysis beyond traditional momentum indicators
Keep exploring
What we’ve verified
Access, alerts and repainting behaviour have not been independently verified for this indicator. Check the creator’s current publication and settings.
General descriptions and classifications are recovered research. Verified details above identify the specific checks we have completed. Check the creator’s current publication for later changes.