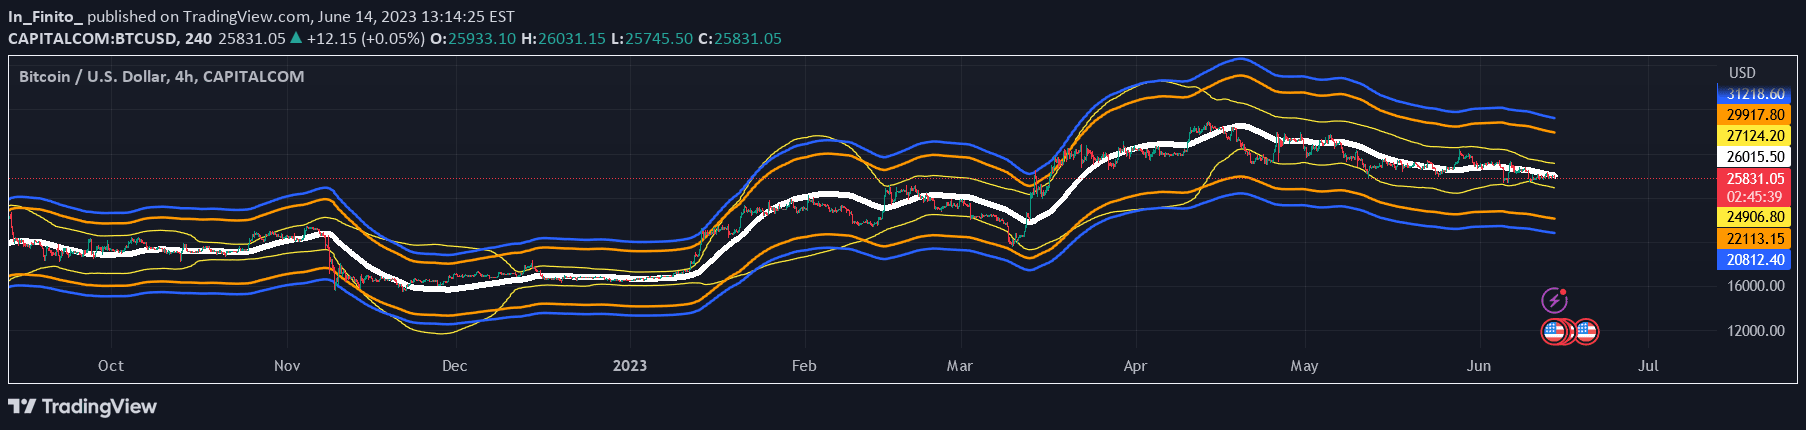
A technical analysis tool combining Bollinger Bands with Fibonacci ratios to identify dynamic price levels and potential market reversals across different trading timeframes.
Explore complementary indicator rolesHow it works
The Fibonacci Enhanced Bollinger Bands indicator calculates price bands using a selected Fibonacci ratio applied to standard deviation around a Simple Moving Average (SMA). This unique approach dynamically adjusts the bands based on market volatility, creating a flexible framework for analyzing price movements.
By integrating Fibonacci ratios with traditional Bollinger Bands, the indicator provides traders with a more nuanced view of potential support and resistance levels. The bands expand and contract based on price volatility, with Fibonacci ratios offering additional precision in identifying potential entry and exit points.
Why it may be useful
This indicator is crucial for traders seeking a comprehensive approach to market analysis that combines volatility measurement with strategic level identification. By blending Bollinger Bands' volatility insights with Fibonacci ratios' mathematical precision, traders gain a more sophisticated tool for understanding market dynamics and potential price reversals.
The combination allows traders to identify overbought and oversold conditions more effectively, providing a robust framework for making informed trading decisions. This approach helps traders minimize risk and maximize potential profit opportunities across various market conditions and asset classes.
When to explore it
The Fibonacci Enhanced Bollinger Bands are most effective in markets with clear trends and moderate to high volatility. Traders can utilize this indicator when seeking to identify potential trend reversals, establish strategic entry and exit points, and gauge market momentum across different timeframes.
It is particularly useful in liquid markets such as forex, stocks, and commodities, where price movements are more predictable and technical analysis can provide meaningful insights. Traders should combine this indicator with other technical and fundamental analysis tools to enhance its effectiveness and reduce potential false signals.
Keep exploring
What we’ve verified
Access, alerts and repainting behaviour have not been independently verified for this indicator. Check the creator’s current publication and settings.
General descriptions and classifications are recovered research. Verified details above identify the specific checks we have completed. Check the creator’s current publication for later changes.