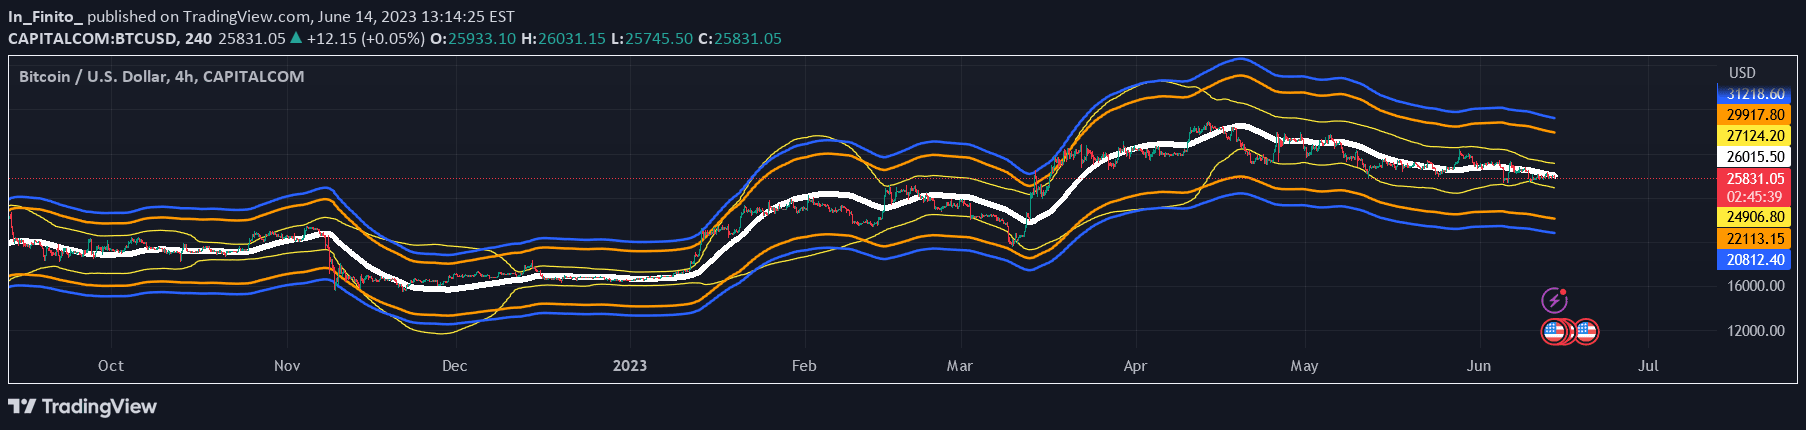
A multi-line Bollinger Band indicator that plots 9 upper and lower lines with increasing length, using a 0.618 level for each line's placement.
Explore complementary indicator rolesHow it works
This indicator creates a series of nested Bollinger Bands by plotting 9 upper and lower lines with progressively increasing lengths. Each line is positioned at the 0.618 Fibonacci retracement level of the standard Bollinger Band, creating a multi-layered visual representation of price volatility. The multiple lines provide a more nuanced view of potential price movement and volatility ranges.
The lines are symmetrically placed above and below the central price movement, offering traders a comprehensive view of potential price boundaries. By using the 0.618 level for each line, the indicator provides a more refined analysis of potential price support and resistance zones compared to traditional single-band Bollinger indicators.
Why it may be useful
This multi-line Bollinger Band approach offers traders a more sophisticated method of analyzing price volatility and potential market movements. By providing multiple layers of analysis, traders can gain deeper insights into potential price ranges and market dynamics that might be missed with traditional single-band indicators.
The nested lines help traders identify more precise entry and exit points, as well as potential trend reversals or continuations. The 0.618 Fibonacci level adds an additional layer of mathematical precision to the volatility analysis, making the indicator more robust and potentially more predictive than standard volatility tools.
When to explore it
This indicator is most effective in markets with clear trending or ranging characteristics, where volatility plays a significant role in price movement. Traders can use this tool to identify potential breakout points, assess market volatility, and make more informed trading decisions across different timeframes.
It is particularly useful for short-term trading strategies like scalping and day trading, where quick identification of potential price boundaries is crucial. Traders should combine this indicator with other technical analysis tools to confirm signals and reduce the risk of false positives.
Keep exploring
What we’ve verified
Access, alerts and repainting behaviour have not been independently verified for this indicator. Check the creator’s current publication and settings.
General descriptions and classifications are recovered research. Verified details above identify the specific checks we have completed. Check the creator’s current publication for later changes.