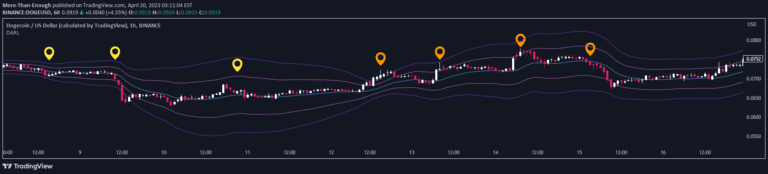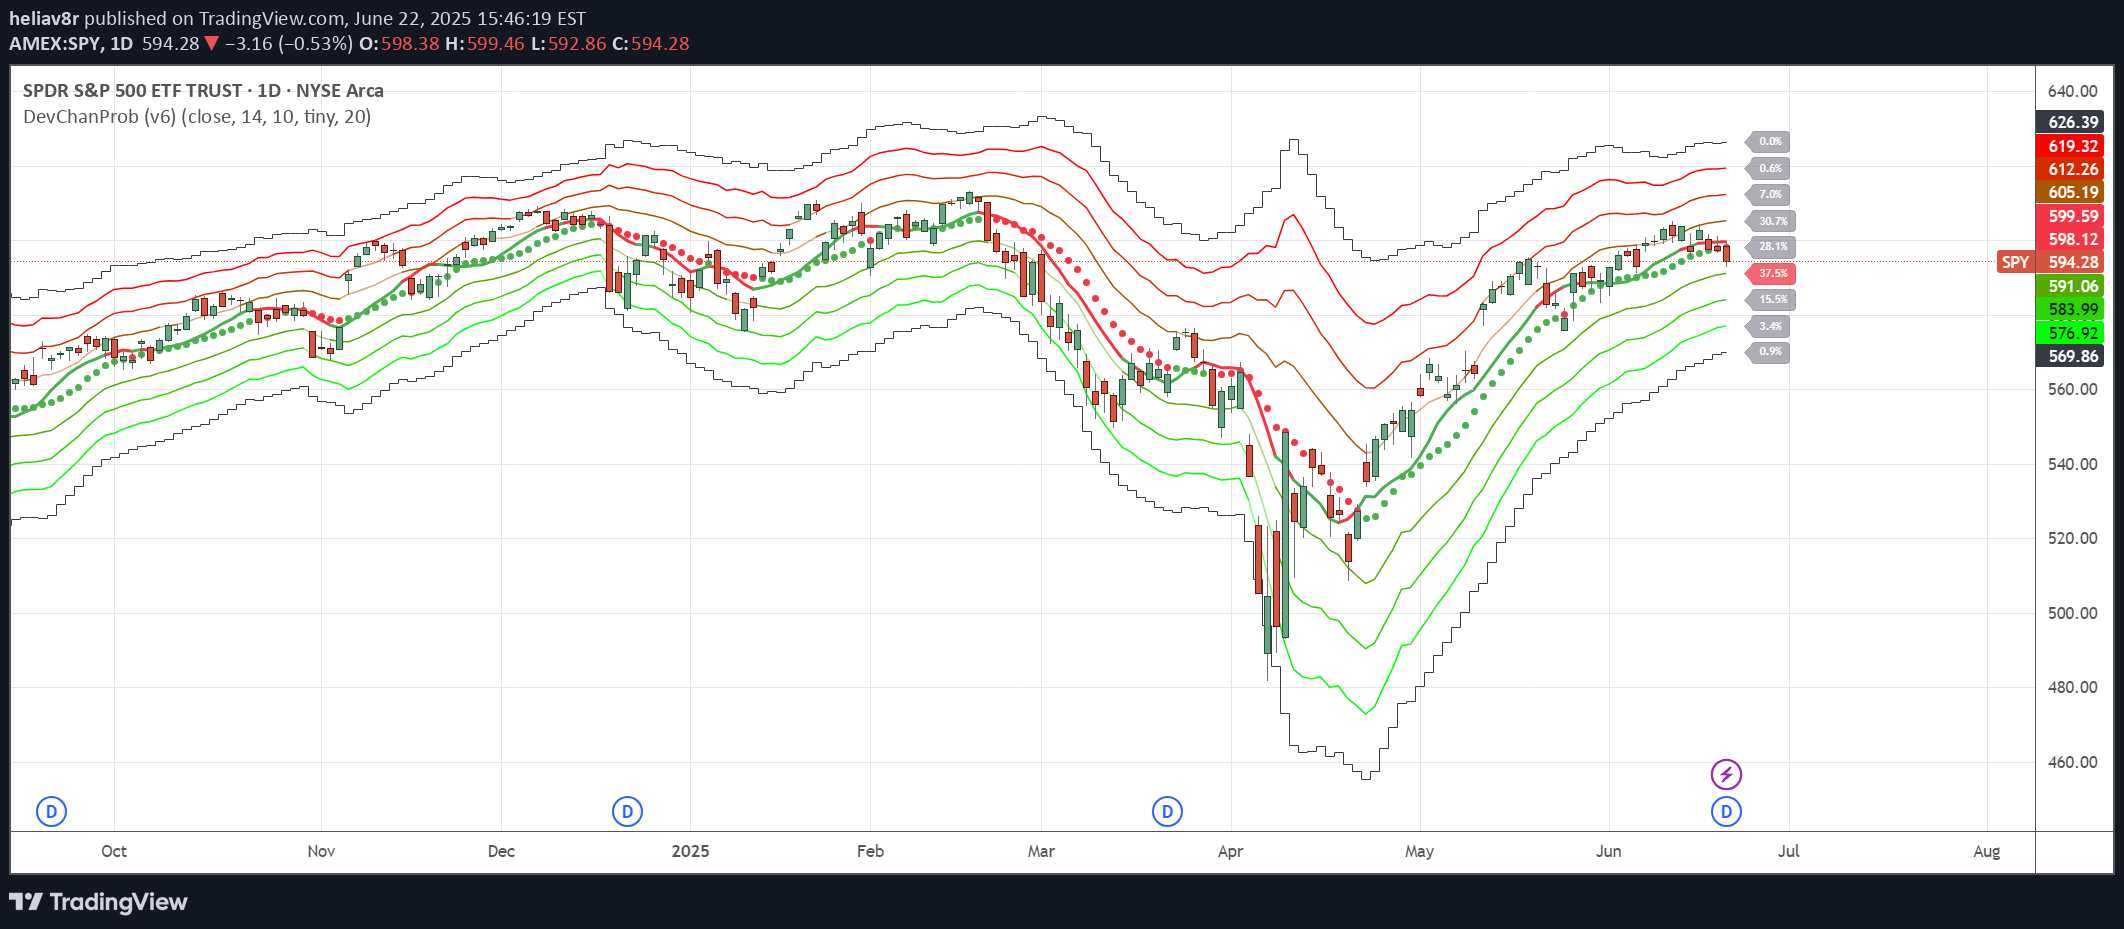
Deviation Channels visualize price volatility using Keltner Channels, providing traders with dynamic support/resistance levels and trend direction insights through color-coded bands and a fast moving average.
Explore complementary indicator rolesHow it works
The Deviation Channels indicator creates multiple bands around a central average line using Keltner Channel methodology. It plots four levels above and below the central line, with each band representing a different deviation level from the average price.
A fast simple moving average (SMA) is overlaid to indicate short-term momentum. The bands change color intensity based on price position, helping traders quickly assess market conditions. Traders can adjust the input source and channel length to customize the indicator's sensitivity and responsiveness
Why it may be useful
Deviation Channels provide traders with a comprehensive visual tool for understanding market volatility and potential price movements. By displaying multiple deviation levels, traders can identify key support and resistance zones more effectively.
The color-coded bands offer immediate insights into price positioning and potential trend reversals. The fast SMA adds an extra layer of momentum analysis, helping traders quickly determine short-term market sentiment. This multi-dimensional approach allows for more nuanced trading decisions and improved risk management strategies
When to explore it
Deviation Channels work best in trending markets with consistent price movements. They are particularly useful for identifying potential entry and exit points during pullbacks or trend continuations. Traders should utilize this indicator when seeking to understand market volatility and momentum across different asset classes.
It is most effective when combined with other technical analysis tools and fundamental research. The indicator can help traders manage risk by providing clear visual references for stop-loss and take-profit levels
Keep exploring
What we’ve verified
Access, alerts and repainting behaviour have not been independently verified for this indicator. Check the creator’s current publication and settings.
General descriptions and classifications are recovered research. Verified details above identify the specific checks we have completed. Check the creator’s current publication for later changes.