
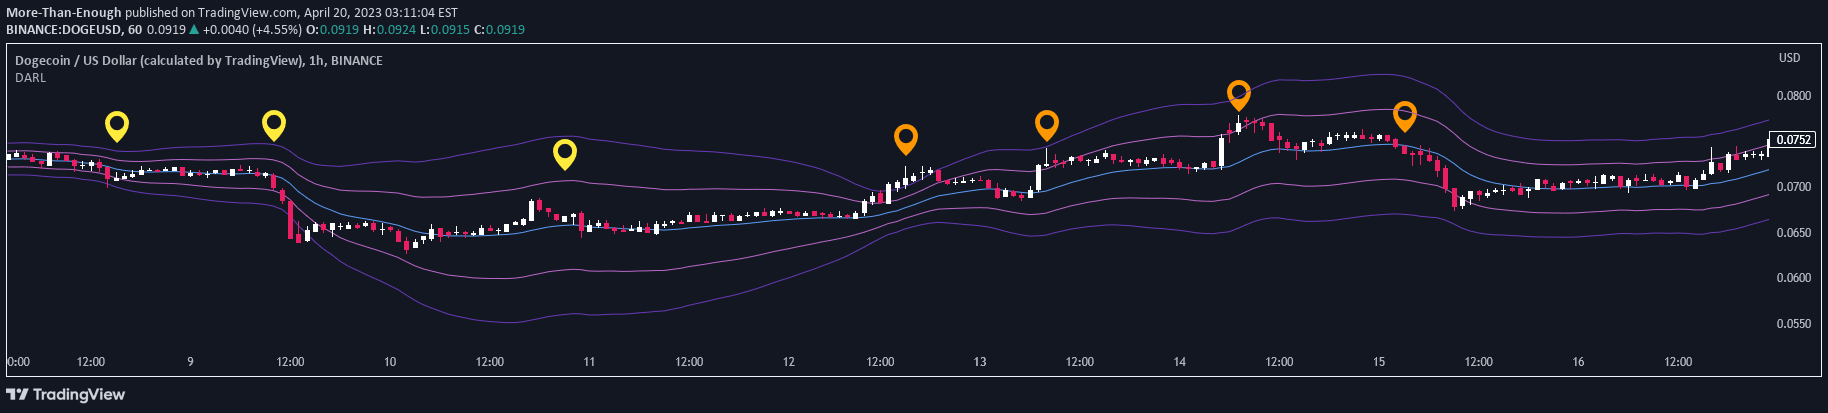
An adaptive indicator using standard deviations from Adaptive Rebound Lines (ARL) that anticipates price rebound strength and direction by incorporating market volatility.
Explore complementary indicator rolesHow it works
This indicator uses standard deviations from Adaptive Rebound Lines (ARL) with a unique approach that integrates market volatility into its calculations. Unlike standard ARL, it dynamically adjusts its standard deviation measurements by considering the current market volatility, which allows for more responsive and adaptive tracking of potential price rebounds.
The calculation process involves analyzing price movements and volatility simultaneously, creating lines that not only indicate potential rebound zones but also suggest the strength and potential direction of those rebounds. By incorporating volatility into its core calculations, the indicator provides traders with a more nuanced view of potential price movements.
Why it may be useful
This indicator offers traders a sophisticated tool for understanding potential price reversals with greater depth and precision than traditional methods. By integrating volatility into its calculations, it provides insights that go beyond simple price movement tracking, allowing traders to anticipate potential market shifts with increased confidence.
The unique ability to predict rebound strength and directional bias makes this indicator particularly valuable for traders seeking to understand market dynamics more comprehensively. Its adaptive nature means it can provide meaningful signals across different market conditions, helping traders make more informed decisions.
When to explore it
This indicator is most effective when used on 1-hour timeframes, where its adaptive qualities can best capture market volatility and potential price rebounds. Traders should pay close attention when the indicator shows smaller price movements coinciding with increasing width, as this often signals an imminent significant price move.
The indicator is particularly useful in markets experiencing transitional or consolidating phases, where identifying potential breakout directions becomes crucial. Traders should combine this indicator with other technical analysis tools to confirm signals and reduce the likelihood of false positives.
Keep exploring
What we’ve verified
Access, alerts and repainting behaviour have not been independently verified for this indicator. Check the creator’s current publication and settings.
General descriptions and classifications are recovered research. Verified details above identify the specific checks we have completed. Check the creator’s current publication for later changes.


