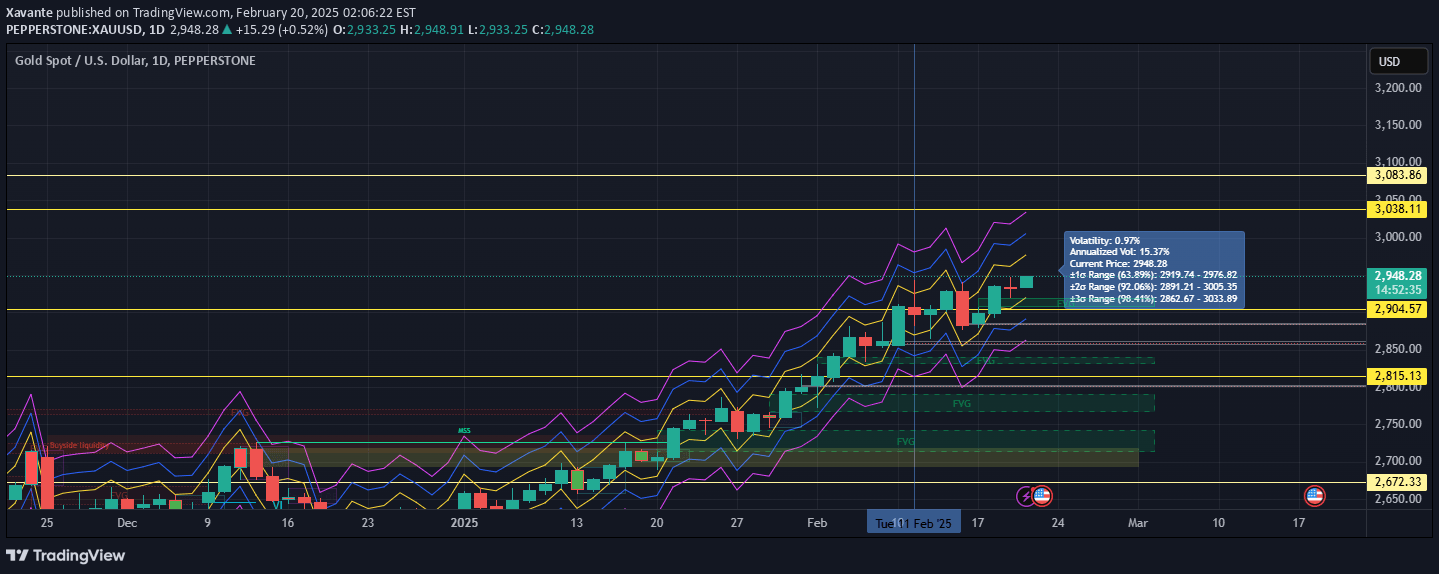
Wilder's Channel is a dynamic indicator using Wilder's Moving Average and Average True Range to create price boundaries that help traders identify trend direction and market volatility.
Explore complementary indicator rolesHow it works
The Wilder's Channel uses two Wilder's averages calculated from high and low prices over a specific period, which are then modified by the Average True Range value. These calculations create upper and lower boundary lines that dynamically adjust around the current price action, forming a channel that represents potential support and resistance levels.
By combining Wilder's Moving Average with the Average True Range, the indicator generates adaptive lines that expand during increased volatility and contract during stable market conditions. The channel's width provides traders with immediate visual insights into market dynamics, helping them understand price movement and potential trend strength.
Why it may be useful
The Wilder's Channel offers traders a comprehensive view of market conditions by simultaneously presenting trend direction, volatility, and potential support/resistance zones. Its adaptive nature allows traders to quickly assess market behavior without relying on static indicators, providing a more dynamic and responsive analytical tool.
By integrating multiple technical analysis concepts into a single indicator, traders can make more informed decisions about market entry and exit points. The channel's ability to illustrate volatility changes helps traders manage risk and adjust their strategies according to current market conditions.
When to explore it
The Wilder's Channel is most effective in markets with clear trending characteristics, where price movements demonstrate consistent directional momentum. Traders can utilize this indicator in various financial markets, including stocks, forex, commodities, and cryptocurrencies, to identify potential trend reversals and assess market volatility.
Optimal usage occurs during periods of moderate to high market activity, where price fluctuations provide meaningful signals. Traders should combine the Wilder's Channel with other technical indicators to confirm signals and reduce the likelihood of false interpretations, especially during periods of market uncertainty or low liquidity.
Keep exploring
What we’ve verified
Access, alerts and repainting behaviour have not been independently verified for this indicator. Check the creator’s current publication and settings.
General descriptions and classifications are recovered research. Verified details above identify the specific checks we have completed. Check the creator’s current publication for later changes.